

Your checkout test has been live for a week and a half when the dashboard shows a lift, and by the afternoon the team has a ship date, a release note, and a closed ticket. Nobody asks how many independent units that lift rests on, or what anyone predicted before the test started.
That gap costs more than one wasted fortnight. Ship on a noisy readout and you've hard-coded a change nobody can defend six months later. Kill a real improvement and the team learns to distrust its own data. Both outcomes teach the same bad lesson: whoever refreshes the dashboard fastest decides.
How do you design an experiment that survives a skeptical review? You make the consequential choices early, in the order a senior analyst would raise them: the question, the unit of randomization, the measures, the arithmetic, and the rule for reading the result. What follows walks through each with the numbers shown and the failure points named.
Frame the Question and Hypothesis Before Any Test
A checkout team has two candidate forms. The old one asks for five fields, the new one for three, and the room is arguing about which looks cleaner. That argument can't be settled by an experiment, because it isn't a question about a number.
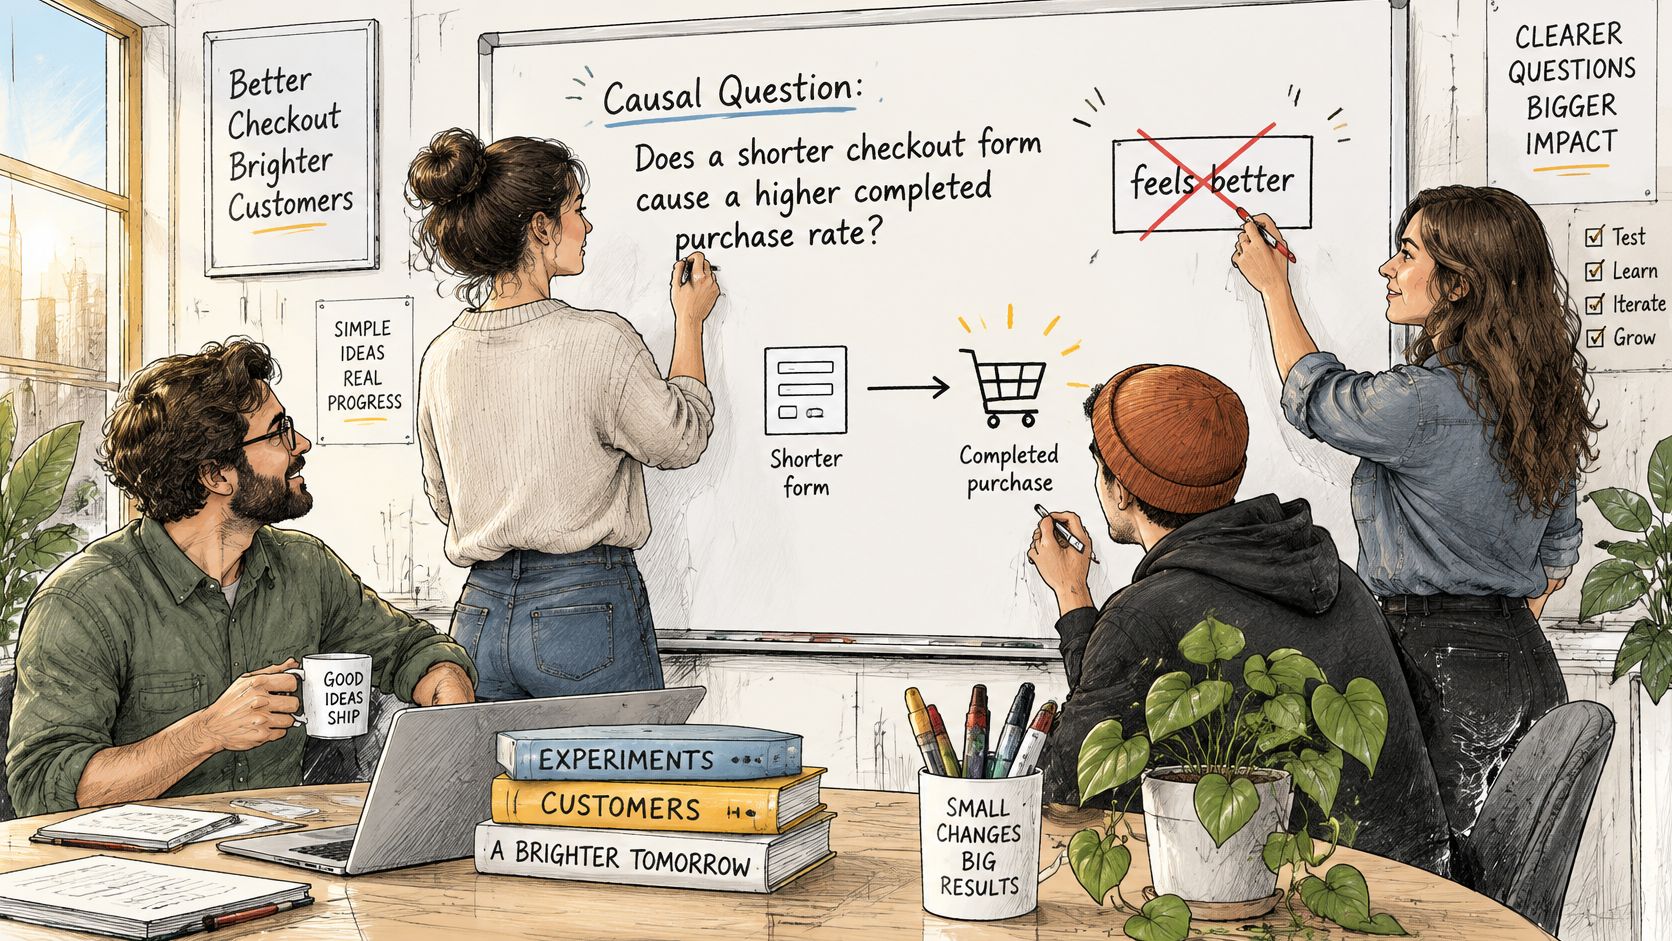
The experiment-shaped version is narrower. Does replacing the five-field checkout form with a three-field version raise the share of new mobile visitors who complete a purchase within 14 days? One population, one window, one comparison. The quantity you're estimating is the change in conversion attributable to the treatment, and the NIST/SEMATECH handbook on experimental design treats that definition as the first step of a pre-registered decision process, ahead of sample size and ahead of code.
The three sentences to write before anything else
- Write the causal question in one sentence. Include the population and the time window, because "conversion" without them can mean a session, a user, a trial, or a quarter. New mobile visitors in the last 14 days is a population. "Users" is not. If you don't yet know which friction to attack, user research techniques can point you at the right moment in the flow; the experiment's only job is to measure whether fixing it moved the number.
- Turn it into a prediction with a direction and a size. Say the three-field form raises checkout completion by at least 0.5 percentage points for new mobile visitors within 14 days. The size matters as much as the direction. A prediction of "better" can't fail, and a test that can't fail isn't evidence.
- Name one primary outcome and define the event that counts. Completion means the order-confirmation event fired. It doesn't mean the browser reached a thank-you page, and it doesn't mean the user clicked a button labelled Pay. Put the definition in writing before launch so nobody reinterprets it afterward.
Without step two, every movement becomes a win. A 0.1 point bump gets called a trend, a dip gets called noise, and the analyst picks a story after seeing the data, which is the same as picking the answer. The handbook lists that exact failure, alongside stopping when a dashboard first crosses p < 0.05 and testing many variants without multiplicity control, as among the most common ways a test stops meaning anything.
The design that follows rests on principles the handbook names: comparison, replication, randomization, control, representation, and blocking. Comparison means a control group still sees the current experience. Replication means someone else can reproduce the result. Randomization and concealment keep the groups alike on everything except the treatment. Representation means the sample resembles the people you'll ship to. Blocking keeps nuisance factors such as device or customer tier balanced inside each group rather than trusting luck.
Ask this before opening the dashboard: can a colleague state, right now, what result would make this experiment fail?
If the answer takes more than one sentence, you have a demo with a chart attached.
Choose the Design and the Unit of Randomization
The design follows from two facts: where the change lives, and where a person meets it. Six patterns cover most of what a product team runs.
| Design | Use when | Randomize at | Main risk |
|---|---|---|---|
| A/B test | Testing one change against the current experience | User | Novelty effects and sample ratio drift |
| Multivariate (factorial) test | Comparing several factors at once | User | Each cell needs its own sample, so power drops fast |
| Holdout group | Measuring the long-run effect of a shipped feature | User | A small holdout gives wide intervals |
| Account or team test | B2B products where users share data or workflows | Account | Few units, so power is low |
| Geographic or market test | Rollouts that cannot be split by user | Market or region | Few markets make comparisons fragile |
| Before-and-after comparison | Quick look at a change with no control group | None | Cannot separate the change from trends or seasonality |
Why the randomization unit decides the sample
Row four is where good tests break without notice. Say a B2B tool runs a user-level A/B test on a redesigned dashboard. Forty accounts take part, each with about twelve active users, so the report shows 480 users per arm and a comfortable sample. If people inside one account share a workflow, a manager's preference, or a shared data model, their behavior is correlated, and the count of independent units is closer to 40.
Recent methodological guidance in Nature Communications names the error: pseudoreplication, treating repeated measurements or multiple observations from one source as independent. A sample that looks large can contain far fewer independent experimental units than reported, which is how a test with 480 users ends up with the statistical power of 40.
You can check for contamination directly. Ask whether control users can see treatment users' content. Shared dashboards, shared notifications, a teammate's new button appearing in a common workspace, a rollout that reaches one region first. If treatment leaks into control, the measured difference shrinks toward zero and you conclude the feature did nothing.
A before-and-after comparison dodges the unit question and pays a different price. Seasonality, a pricing change, or a marketing push moves both the old and the new numbers, so the jump can't be attributed to the change you made. With no control and no randomization, the comparison can't establish causation, whatever the size of the jump.
The mechanics are the easy part. A deterministic assignment rule, a feature toggle that keeps a person in one variant across sessions, and group membership logged in your events table will do more for validity than another month of traffic.
The basic gist is this: before you brief anyone, write one sentence naming the randomization unit, the analysis unit, and the reason for each. Randomize the account, analyze at the account level, because twelve colleagues inside one workspace don't cast twelve independent votes.
Pick Primary, Guardrail and Diagnostic Measures
A growth team raises sign-up button clicks by a third. The launch looks successful until seven-day activation stays flat and support tickets from new users who cannot find anything double. Clicks capture an interaction; they do not necessarily capture value.
Choose measures by the decision each one is allowed to influence.
Primary, guardrail, diagnostic, in that order of authority
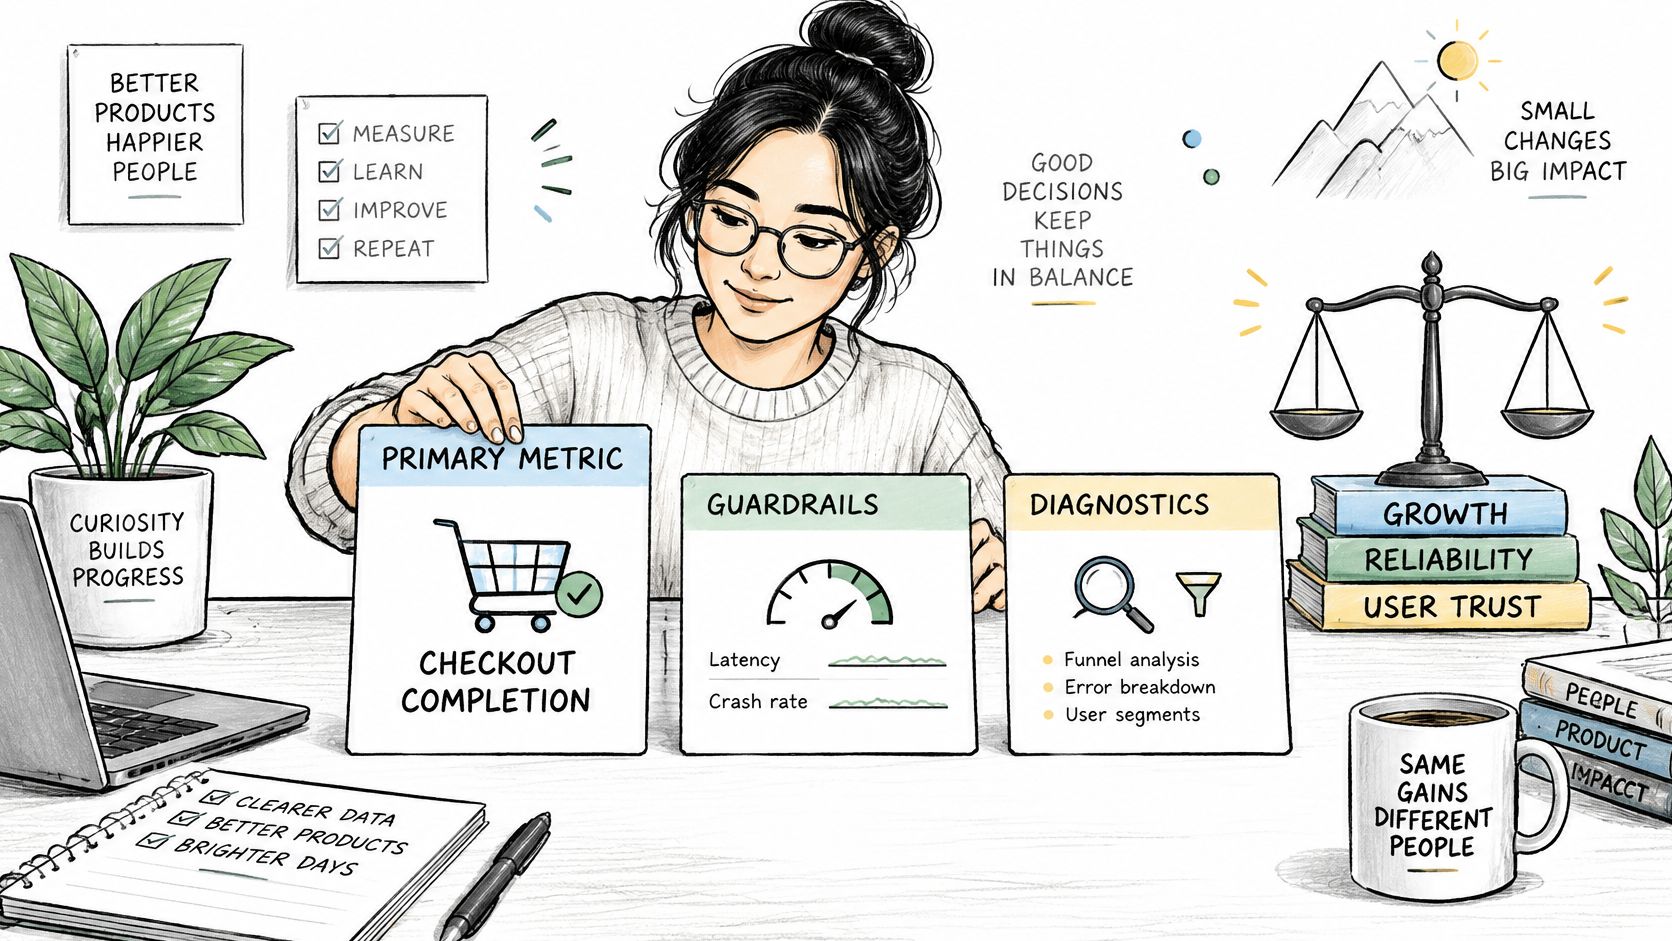
Primary. Choose one outcome to decide whether the test succeeded. For this team, that might be seven-day activation: a user completes setup and returns within a week. Define the event, observation window, and denominator before launch so the measure means the same thing in both groups.
Guardrails. Choose two to four measures that could veto a rollout if they worsen:
- Latency and crash rate. A faster sign-up flow is not a win if it becomes slower or less reliable on some devices.
- Support contacts. More tickets can reveal confusion that conversion metrics miss.
- Refund and return rate. These help distinguish lasting value from revenue that arrives sooner but does not hold.
- Retention at the next cycle. This can catch short-term gains that come at the expense of continued use.
Diagnostics. Choose two or three measures that help explain why the primary changed, such as step-level drop-off, form-field errors, time to complete, or back-navigation. They guide investigation; they do not determine success.
A metric is useful only if it can move within the test window, is difficult to inflate without helping users, and reflects user value rather than internal activity. A measure that changes only once a quarter cannot explain a short test. A proxy event that teams can increase without improving the experience can point in the wrong direction.
Some outcomes arrive late. If renewal or expansion takes longer to observe, define a proxy in advance and explain why it should track the outcome. Also be careful with metrics that only exposed users can generate, such as clicks on a treatment-only feature. Comparing those clicks with a control group that could never make them is not a like-for-like test.
One rule that ends most metric arguments: the primary decides, guardrails can veto, diagnostics only explain.
Use guardrail practices from Figr as a reference when deciding which harms a test should catch. Record each measure's definition, observation window, and denominator before launch. That record keeps the team from changing what success means after results appear.
Calculate Sample Size and Assign Traffic Correctly
Do the arithmetic before anyone writes code. A sample-size argument after launch is really a negotiation about what you're willing to believe.
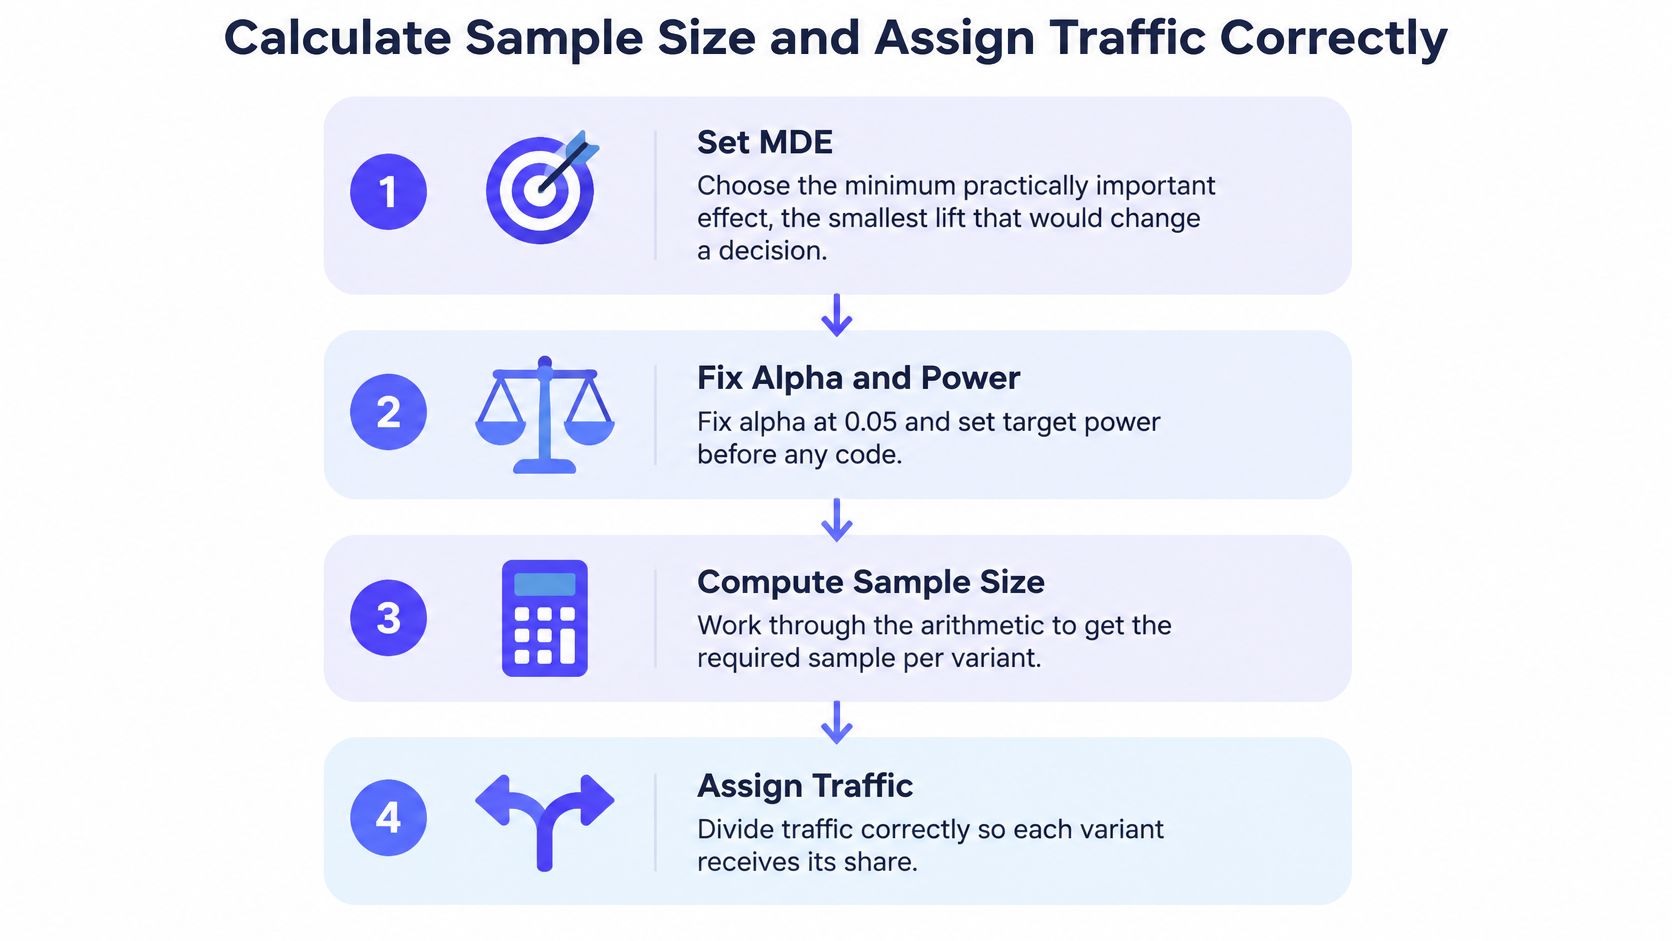
- Step 1. Set the minimum practically important effect. This is the smallest lift that would change a decision, not the smallest lift you'd enjoy. If a 0.3 point gain wouldn't alter a roadmap, don't build a test around detecting it.
- Step 2. Fix alpha and power. Two-sided alpha at 0.05, power at 80 percent, or 90 percent when the decision is expensive to reverse. Both numbers go in the protocol, not in a slide someone edits later.
- Step 3. Compute the sample from the baseline rate and the effect. You need the current conversion rate and the target rate. For a proportion, that's the standard two-proportion formula; any sample-size calculator will do it once you have those two inputs.
- Step 4. Write the assignment rule. Hash a stable user or account identifier into a variant so membership persists across sessions and devices. Assignment must not depend on behavior observed after the user is bucketed.
- Step 5. Stratify or block on nuisance variables. Device class, geography, customer tier, traffic intensity. Blocking keeps those factors similar inside each arm rather than trusting randomization to balance them at small samples.
- Step 6. Run the checks before reading any result. Confirm exposed users match assigned users, check the sample ratio between arms, and count missing events. A sample ratio mismatch means the plumbing is broken, not that the treatment worked.
The worked example, checked line by line
Take a checkout with a 4.0 percent baseline conversion, a minimum effect of 0.5 points to 4.5 percent, two-sided alpha 0.05, and 80 percent power. Those inputs are illustrative, chosen so you can follow the arithmetic.
| Input or result | Value |
|---|---|
| Baseline conversion | 4.0 percent |
| Minimum effect | 0.5 points, to 4.5 percent |
| Alpha and power | Two-sided 0.05, 80 percent |
| Users per arm | About 25,500 |
| Total users | About 51,000 |
| Eligible traffic | 3,000 users per day |
| Runtime | about 17 days, at least 3 full weeks |
| Failure case, 0.2-point lift | About 160,000 per arm, more than three months |
The two-proportion calculation lands near 25,500 users per arm, so roughly 51,000 in total. At 3,000 eligible users a day split evenly, that's about 17 days of pure accrual. Round up and run three full weeks, because weekly cycles move conversion and a test that ends mid-week measures a different population than the one you started with.
The failure case is worth sitting with. Chase a 0.2 point lift instead of 0.5 and the required sample grows by roughly six times, to about 160,000 per arm. At this traffic the test would run more than three months, which means the answer arrives after the roadmap has moved. You can read the minimum detectable effect guidance if you want the fuller treatment of that trade-off.
One assumption hides in every one of these numbers: that every eligible user enters the test. They don't. Some never load the page, some are blocked by an existing session, some drop out of the event pipeline. Calculate on assigned users, then check exposure, and don't inflate the observed data to replace the people who disappeared. That doesn't recover information, it just makes the interval look narrower than the evidence supports.
The test before the test: if the required sample exceeds your traffic for the quarter, change the effect size, the design, or the question. Never change the standard.
Reading Results Without Fooling Yourself
The most common misreading in a product review is that a p-value tells you the probability the change is real. It doesn't. The American Statistical Association's statement on p-values frames it as a measure of incompatibility with a specified statistical model, not the probability that a hypothesis is true, and not a measure of effect size or practical importance.
Start with the number a stakeholder can use. Compute the treatment-minus-control difference, the relative lift, and the confidence interval around it. Add the absolute change in the rate, because 0.4 points on a 4 percent baseline reads very differently from 0.4 points on a 40 percent baseline.
Then ask a sharper question than "is it significant": does the interval exclude effects smaller than the threshold that matters? A statistically significant 0.2 percent lift can be commercially irrelevant. A non-significant 3 percent lift with a wide interval can justify a larger confirmatory test, provided the downside is limited. The label tells you about the model. The interval tells you about the decision.
Daily dashboard checks are where good tests go to die. Stop looking at the first moment p dips below 0.05 and you inflate false positives, because you've given yourself dozens of chances to stop at a lucky morning. Predefine the stopping rule, the minimum runtime covering full weekly cycles, and a replication or staged rollout before anything becomes permanent.
Subgroup findings count only when they were pre-specified. A lift that appears among Android users in week three, discovered by clicking around, is a hypothesis for the next test. Label it exploratory and move on.
The pressure to ship isn't irrational, and that's the zoom-out worth keeping in mind. Teams are rewarded for launches, not for careful nulls, so the design has to protect the decision from the incentive. Document the instrumentation, the analysis code, the exclusions, and the missing-data handling while the test runs, because the ASA identifies poor design, insufficient data, model-choice errors, inadequate description, and selective reporting as major sources of irreproducibility.
If your primary measure is a lead or a signup rather than a purchase, defining what counts as qualified has to happen before launch. A definition invented after the results arrive will always be the one that makes the test look good.
| Result pattern | What it means | Next step |
|---|---|---|
| Significant lift above the MDE, guardrails flat | Strong evidence for the change | Replicate or roll out in stages before permanent adoption |
| Significant lift below the MDE | Real but commercially small effect | Compare shipping cost with value; often do not ship |
| Not significant, interval excludes the MDE | Evidence of no meaningful effect at this sample size | Stop or redesign with a different hypothesis |
| Not significant, interval includes the MDE | Test was underpowered, so no proof of no effect | Run a larger confirmatory test if the downside is limited |
| Primary up, a guardrail down | Local win with a system cost | Do not ship; investigate the trade-off |
| Sample ratio mismatch | Assignment or logging is broken | Discard the result; fix instrumentation and rerun |
In short, the table decides, not the label. Our A/B testing guide covers the same patterns from the instrumentation side.
Questions That Change the Design
How is an experiment different from a usability test?
A usability test watches people attempt a task and finds where they get confused. An experiment estimates the change caused by a treatment. Both matter, and they answer different questions. In 2024, MeasuringU found usability testing used by 69 percent of 444 UX professionals surveyed across 37 countries, which tells you how much qualitative evidence teams already collect. A 2024 Frontiers review catalogued 85 UX measurement scales and 172 constructs in the literature, a reminder that most of those instruments describe experience rather than prove a lift.
What changes when the treatment is generative AI?
The treatment stops being a fixed screen. A 2025 preregistered field experiment assigned 776 Procter & Gamble professionals to work alone, in pairs, alone with AI, or in pairs with AI on real product-development problems. Individuals using AI performed comparably to two-person teams without it, and the AI-assisted solutions were more balanced across technical and commercial ideas. That means a test of an AI feature needs measures of solution quality and decision quality, not just speed or task completion.
Should each analyst invent a reading method?
No. In 2024, Speero reported that 87 percent of mature experimentation programs used a standardized process for interpreting findings. A shared reading method keeps two analysts from reaching opposite conclusions on the same export.
When should you skip an experiment?
Skip it when you can't name an independent unit, when you can't keep a control group clean, or when no result would change a decision. In those cases, a prototype review or a staged rollout with monitoring gives you better information for the cost.
Lock the Protocol and the Allowed Adaptations
A launch sheet should make the experiment's rules clear before results arrive. Record the decisions already made, then specify what can change and under which conditions.
Start with the causal question, predicted effect, primary metric, guardrails, randomization unit, and sample-size result. The randomization unit matters here: it determines which observations are independent, so the protocol should preserve that assignment throughout the test.
Write the decision rule in plain language. For example, ship if the lower bound of the interval clears the minimum effect and guardrails hold; stop if the interval rules out that effect; otherwise, continue or rerun according to the planned rule.
Next, list any permitted adaptations. FDA guidance on adaptive designs recommends stating the number and timing of interim analyses, which design features may change, and the exact rule for each change. That guidance concerns drug and biologic trials, but the discipline is useful in software experiments too. A metric switch after a favorable result is not a planned adaptation.
If assignment probabilities or allocation rules may change as results accumulate, document the trigger and analysis method before launch. The FDA's adaptive design materials discuss sample-size, population, and allocation changes in the context of prespecified rules and error control.
Finally, specify how assignment stays concealed and how exclusions are handled. The CONSORT reporting checklist asks who generated the sequence, whether blocking or stratification was used, and how the sequence stayed hidden until assignment. For a software test, also state how persistent variant membership is maintained and prohibit exclusions based on behavior after assignment.
A funnel drop-off can suggest a question, not settle the answer. Figr turns analytics signals into testable UX questions about why users leave, what they may not understand, which states need review, and what product evidence is missing. Use those questions to sharpen the protocol before launch.
Choose one backlog test and write its rules before the next review. A protocol makes clear what the experiment can answer, and what changes would make its results harder to trust.
A testable flow and clear edge cases make the launch sheet easier to complete. Figr analyzes UX before designing, surfaces assumptions and unanswered questions, and can turn the reasoning into a prototype. Designers review and refine the work before anything ships. Explore Figr to see how its reasoning appears before a design is treated as final.