
It’s Tuesday morning. The conversion rate for your new checkout flow is flat. One engineer thinks the button is too small, a designer argues the copy is weak, and your product manager is convinced the payment options are the problem. You have opinions, anecdotes, and a rising sense of dread.
What you don't have is a clear signal.
This is the moment most product teams get stuck, mistaking the loudest voice for the right one. They treat product development like a monologue, broadcasting changes and hoping for the best. The most effective teams see it differently. They see a two-way mirror. On one side, they build. On the other, users react. An experiment is the mechanism that clears the glass, turning murky behavior into a crisp, undeniable signal.
The basic gist is this: effective A/B testing isn't about being right, it’s about getting less wrong, faster. It’s a system for converting uncertainty into evidence. But this system has rules, ones often misunderstood or ignored. Getting these A/B testing best practices right is the difference between incremental gains and chasing ghosts in the data.
This guide covers those rules. We’ll move from crafting a rock-solid hypothesis to building a continuous learning system. You will learn the practical steps to design, execute, and analyze experiments that drive real growth, avoiding the common pitfalls that invalidate results and waste valuable development cycles.
1. Practice 1: The Hypothesis Is Your Compass, Not Your Map
Your team has an idea. The impulse is to jump straight into building it to see what happens. This is like setting sail without a destination: you're moving, but are you getting closer to anything valuable? A proper hypothesis is your navigational instrument. It's a specific, falsifiable statement connecting a deliberate change to a predicted, measurable outcome.
Think of your product analytics as a vast, quiet ocean. A good hypothesis is the sonar ping you send out, designed to echo back a specific signal. A friend running growth at a fintech company recently told me, "We stopped testing 'ideas' and started testing 'theses'." That shift in language changed everything. It forced them to articulate why they believed a change would work, grounding their experiments in user psychology or known friction points.
From Vague Idea to Testable Thesis
This isn't just semantics, it's the foundational discipline of effective A/B testing. It prevents you from running experiments that, even if they "win," teach you nothing about your users.
- Weak Idea: Let's test a new headline.
- Strong Hypothesis: By changing the headline from feature-focused ("Advanced AI-Powered Scheduling") to benefit-focused ("Never Ask 'What Time Works for You?' Again"), we will increase sign-ups by 5% among new visitors because it better answers the "what's in it for me?" question within the first three seconds.
With a tool like Figr, you can ground these hypotheses in reality from the start. By analyzing a live app, you can identify concrete drop-off points in a user journey. For instance, an analysis might reveal a confusing step in an e-commerce setup, providing a data-backed starting point for a testable thesis, much like the one explored in this Shopify Checkout Setup Redesign. This approach transforms intuition into a data-informed investigation.
2. Ensure Adequate Sample Size and Statistical Power
Running a test with too few users is like trying to judge a concert from a single note. You hear something, but it’s not the song. You get a result, but it’s just noise, not a signal. Neglecting sample size calculation is the single most common reason promising experiments yield inconclusive results, wasting weeks of engineering effort on a statistical mirage.
This isn’t about just collecting “a lot” of data, it’s about collecting the right amount of data to confidently detect a real change. Statistical power, typically set at 80%, is your experiment's ability to spot an effect if one truly exists. Running an underpowered test is setting yourself up to miss a winning variation, a false negative that kills a good idea before it has a chance to prove its worth. As Ronny Kohavi details in Trustworthy Online Controlled Experiments, this rigor separates companies that merely test from those that learn and compound their growth.
From Guesswork to Calculated Confidence
Planning your sample size forces a critical conversation before you write a single line of code. It requires you to define your baseline conversion rate, the minimum effect you care about detecting, and your tolerance for error. This discipline prevents you from chasing phantom lifts and ensures your results are credible.
- Weak Plan: Let’s run the test for a week and see what happens.
- Strong Plan: Our baseline sign-up rate is 3%. We want to detect a minimum lift of 10% (an increase to 3.3%). To achieve 80% statistical power at a 95% confidence level, we need 52,000 users per variation. Given our traffic, this test will need to run for 18 days.
This upfront calculation, often done with tools like Optimizely's or VWO’s calculators, transforms your experiment from a gamble into a structured scientific inquiry. It gives you a clear timeline and a shared understanding of what success looks like, which is foundational to any of the best practices for a/b testing.
3. Run Tests for Sufficient Duration (Avoid Peeking)
Your test has been running for three days, and the dashboard is glowing green. The variant is crushing the control group with 98% statistical significance. The temptation is overwhelming: declare victory, ship the winner, and move on. This is like pulling a cake out of the oven because the top is golden brown, ignoring the fact that the inside is still raw batter.
Stopping a test early based on promising results is one of the most common and damaging mistakes in A/B testing.
This phenomenon, known as "peeking," dramatically increases your risk of a false positive. Statistical significance is not a stable destination, it's a fluctuating value that can cross the threshold multiple times during a test. A product leader at a major e-commerce platform once told me, "We celebrated a 20% lift on a checkout button change after four days. We rolled it out, and our quarterly numbers didn't budge. We learned the hard way that our early 'win' was just weekend shopping behavior, not a real improvement."
From Statistical Noise to Reliable Signal
Patience is the core discipline here. One of the most critical A/B testing best practices is letting an experiment run for its full, pre-calculated duration. This ensures you capture the full spectrum of user behavior, smoothing out the random noise of daily fluctuations.
- The Danger of Peeking: Continuously monitoring results and stopping when they look good is a form of data dredging. It guarantees you will eventually find a "significant" result, even if one doesn't exist.
- The Power of Duration: A test must run long enough to collect the required sample size and capture at least one full business cycle, typically one to two weeks. This accounts for behavioral differences between weekday users, weekend shoppers, morning commuters, and evening browsers.
To enforce this discipline, you need to build guardrails into your process. This means setting a non-negotiable end date before the test begins and documenting it in a shared project management tool. By defining the finish line before the race starts, you prevent the team from moving the goalposts based on exciting but unreliable early data. This commitment transforms wishful thinking into a rigorous, repeatable scientific process.
4. Establish Proper Test/Control Group Randomization
Imagine you're trying to prove a new fertilizer makes plants grow taller. You put the new fertilizer on plants in a sunny spot and compare them to unfertilized plants in a shady corner. When the fertilized plants grow taller, what did you prove?
Nothing.
You can't separate the effect of the fertilizer from the effect of the sun. This is the danger you court without proper randomization in A/B testing: your results become meaningless noise. Randomization is the bedrock of a valid experiment. It's the process of assigning users to either the control or test group by the equivalent of a coin flip, ensuring the only systematic difference between the two groups is the change you are testing.
The Science of a Fair Race
This isn't about just splitting traffic 50/50, it's about ensuring the composition of each group is statistically identical before the starting gun fires. Any observed difference in outcomes can then be confidently attributed to your change.
- Flawed Approach: Assigning the first 50% of users on Monday to Group A and the next 50% to Group B. This introduces time-based bias, early-week users might behave differently than late-week users.
- Robust Approach: Using a deterministic hashing algorithm based on a stable user ID. This ensures every user is randomly assigned to a group but will consistently remain in that same group across all sessions and devices, preventing a confusing user experience where the interface changes randomly.
Validating this balance is non-negotiable. Before launching a test, run an A/A test (pitting the control against itself) or check baseline metrics for your newly formed groups. To truly uncover the nuances within your segments and understand the spread of data, consider using visualization tools like one that can help you visualize data distributions with a box and whisker plot maker. This helps you spot imbalances that simple averages might hide, ensuring your test is built on a solid foundation.
5. Monitor and Control for Multiple Comparisons
Imagine playing darts in a dark room. You throw twenty darts, hoping one hits the bullseye. When you hear a thwack, you run to the light switch, flip it on, and declare victory because one dart is near the center. Did you win because of skill, or did one of your nineteen other throws just happen to land there by chance?
This is the statistical danger of testing too many things at once without a plan: the Multiple Comparisons Problem.
Every A/B test has a small, controlled risk of a false positive, a result that looks real but is just statistical noise. When you test a single variation against a single metric, that risk is usually managed at 5% (a p-value of 0.05). But when you test three variations, or look at ten different metrics for a "win," you are essentially throwing more darts. A senior data scientist at Spotify once described it to me as "diluting your discovery power." With each new metric you watch for a win, you increase the odds of being fooled by randomness.
From Data Dredging to Disciplined Observation
Controlling for this isn't about limiting discovery, it's about making your discoveries trustworthy. It prevents you from chasing statistical ghosts and shipping features based on luck. One of the most effective A/B testing best practices is to structure your analysis to preserve statistical integrity.
- Weak Approach: Let's ship this change because it moved any metric in a positive direction.
- Strong Approach: We will decide to ship this feature if, and only if, it increases our primary metric (e.g., subscription starts) with statistical significance. We will also monitor secondary guardrail metrics (e.g., support tickets, latency) to ensure we cause no harm. Other positive movements in exploratory metrics will be noted as interesting findings for future hypotheses, not as justification for this change.
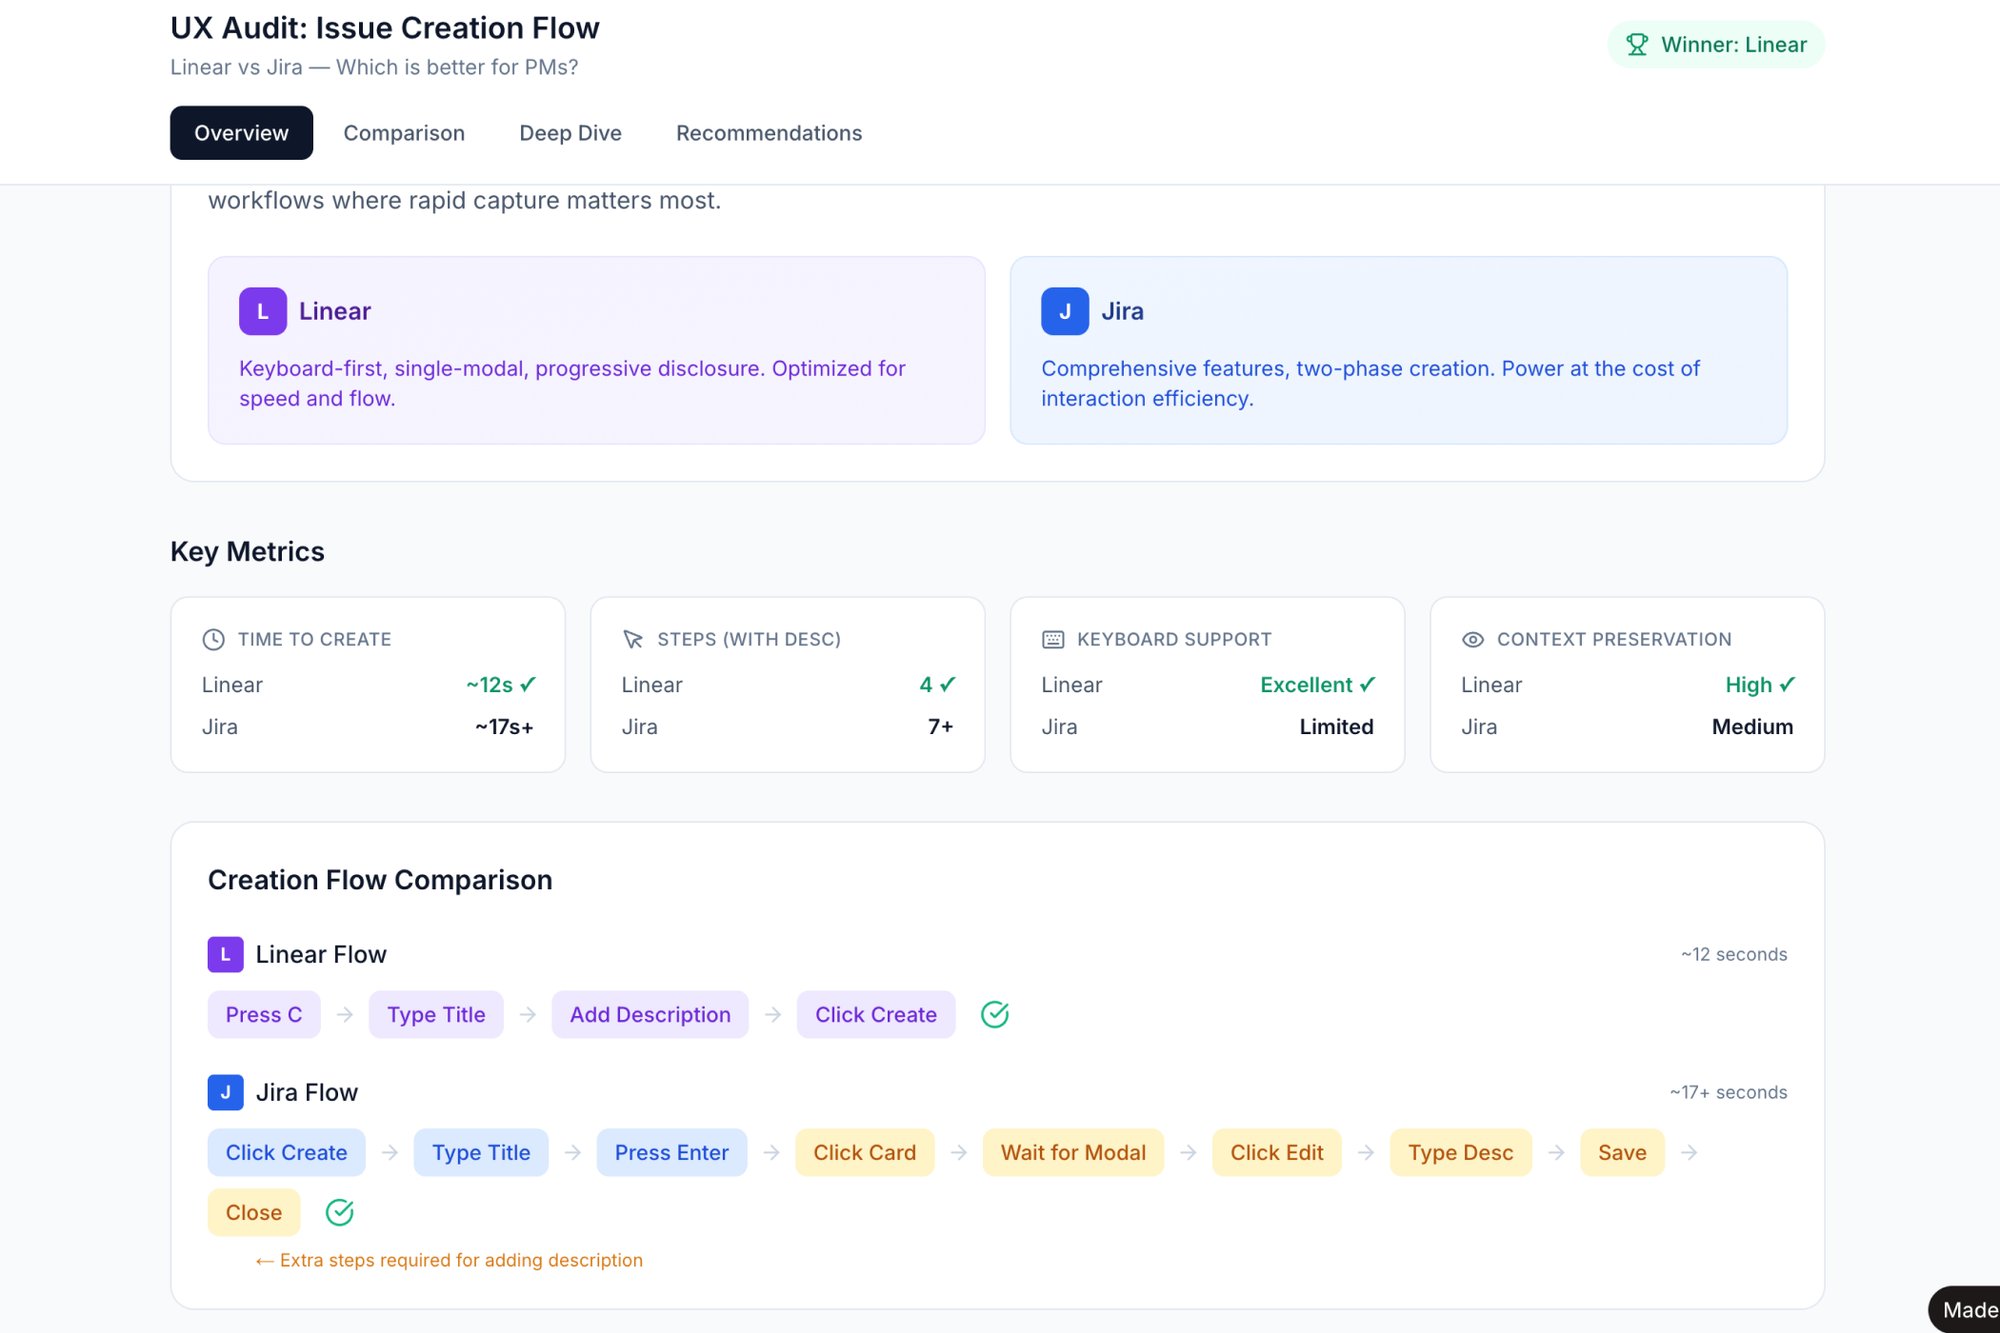
This discipline is core to how mature experimentation platforms operate. LinkedIn famously designates primary metrics to drive decisions while tracking a host of secondary metrics as guardrails. This structured approach, similar to the rigor needed when comparing multiple products like in this Linear vs Jira task creation analysis, ensures you act on the signal, not the noise.
6. Segment Results by User Cohort and Context
An A/B test result is rarely a single, monolithic truth. It is an average. Declaring a winner based on the overall lift is like saying the average temperature of a hospital is 98.6 degrees: it masks the fevers and the chills. True insight comes from looking at how different groups of users react, a practice known as segmentation.
Segmentation is the process of slicing your experiment data by user attributes to find hidden patterns. A feature that delights power users might completely alienate first-time visitors. A design that improves conversion on desktop could crater it on mobile. A senior PM at an e-commerce giant once discovered a checkout change that boosted overall sales but significantly hurt sales for their highest-value customer cohort. Without segmentation, they would have rolled out a change that slowly poisoned their most profitable user base.
From Aggregate Data to Granular Decisions
This analytical discipline is crucial for avoiding harmful rollouts and for uncovering new opportunities. It transforms a simple "win" or "loss" into a nuanced understanding of who you are building for.
- Weak Analysis: The new checkout flow increased conversion by 2%. Let's ship it.
- Strong Segmented Analysis: The new checkout flow increased overall conversion by 2%. However, it decreased conversion by 7% for users on older Android devices and increased it by 5% for iOS users. This suggests a potential performance issue or rendering bug on specific mobile platforms that we need to investigate before a full rollout.
This level of detail is a core part of effective A/B testing best practices. By pre-defining strategic segments (like new vs. returning, mobile vs. desktop, or high-intent vs. low-intent users), you move from confirmatory analysis to strategic exploration. Advanced AI tools can further accelerate this process by identifying behavioral patterns you might not have considered. Discover how AI can help segment users by behavioral patterns to find these hidden insights faster. This approach turns your A/B tests into a powerful user research engine.
7. Document and Communicate Test Results Transparently
An experiment concludes. A winner is declared. The team pushes the change and moves on to the next fire. This is like a scientist discovering a new element but never publishing the paper. The immediate gain is there, but the collective knowledge is lost. Transparent documentation is the peer review process for your product team, turning isolated wins and losses into a durable, organizational asset.
I was talking with a product leader at a large e-commerce company who described their early experimentation process as "oral tradition." Learnings were passed down in meetings and Slack channels, but they evaporated as soon as key people left the team. They realized that without a central, accessible library of results, they were doomed to repeat the same inconclusive tests every 18 months. This shift from ephemeral conversation to permanent record is a hallmark of a mature experimentation culture.
From Tribal Knowledge to a Library of Learnings
Documenting results isn’t just about creating a historical record, it's about building institutional memory and accelerating future decision-making. It's one of the most critical A/B testing best practices because it prevents your team from relearning the same lessons.
- Weak Documentation: "The new button color won. Conversion is up 2%."
- Strong Documentation: A standardized one-pager including:
- Hypothesis: The original "why" behind the test.
- Methodology: Sample size, duration, success metrics, and segmentation.
- Results: Not just the p-value, but the effect size and confidence intervals for key segments.
- Learnings: What did we learn about user behavior, even if the test was flat? For example, "While the primary metric didn't move, we saw a 10% lift in engagement from mobile users in Germany, suggesting a potential cultural or device-specific preference."
- Decision: The specific action taken (e.g., "Roll out to 100%," "Iterate on design for mobile users," "Archive and deprecate").
Building a searchable repository of these documents, like a simple wiki or a shared drive, allows a new PM to get up to speed in days, not months. They can see what’s been tried, what’s worked, what’s failed, and most importantly, why. This creates a powerful feedback loop that makes every subsequent experiment smarter than the last.
8. Account for Interaction Effects and Sequential Testing
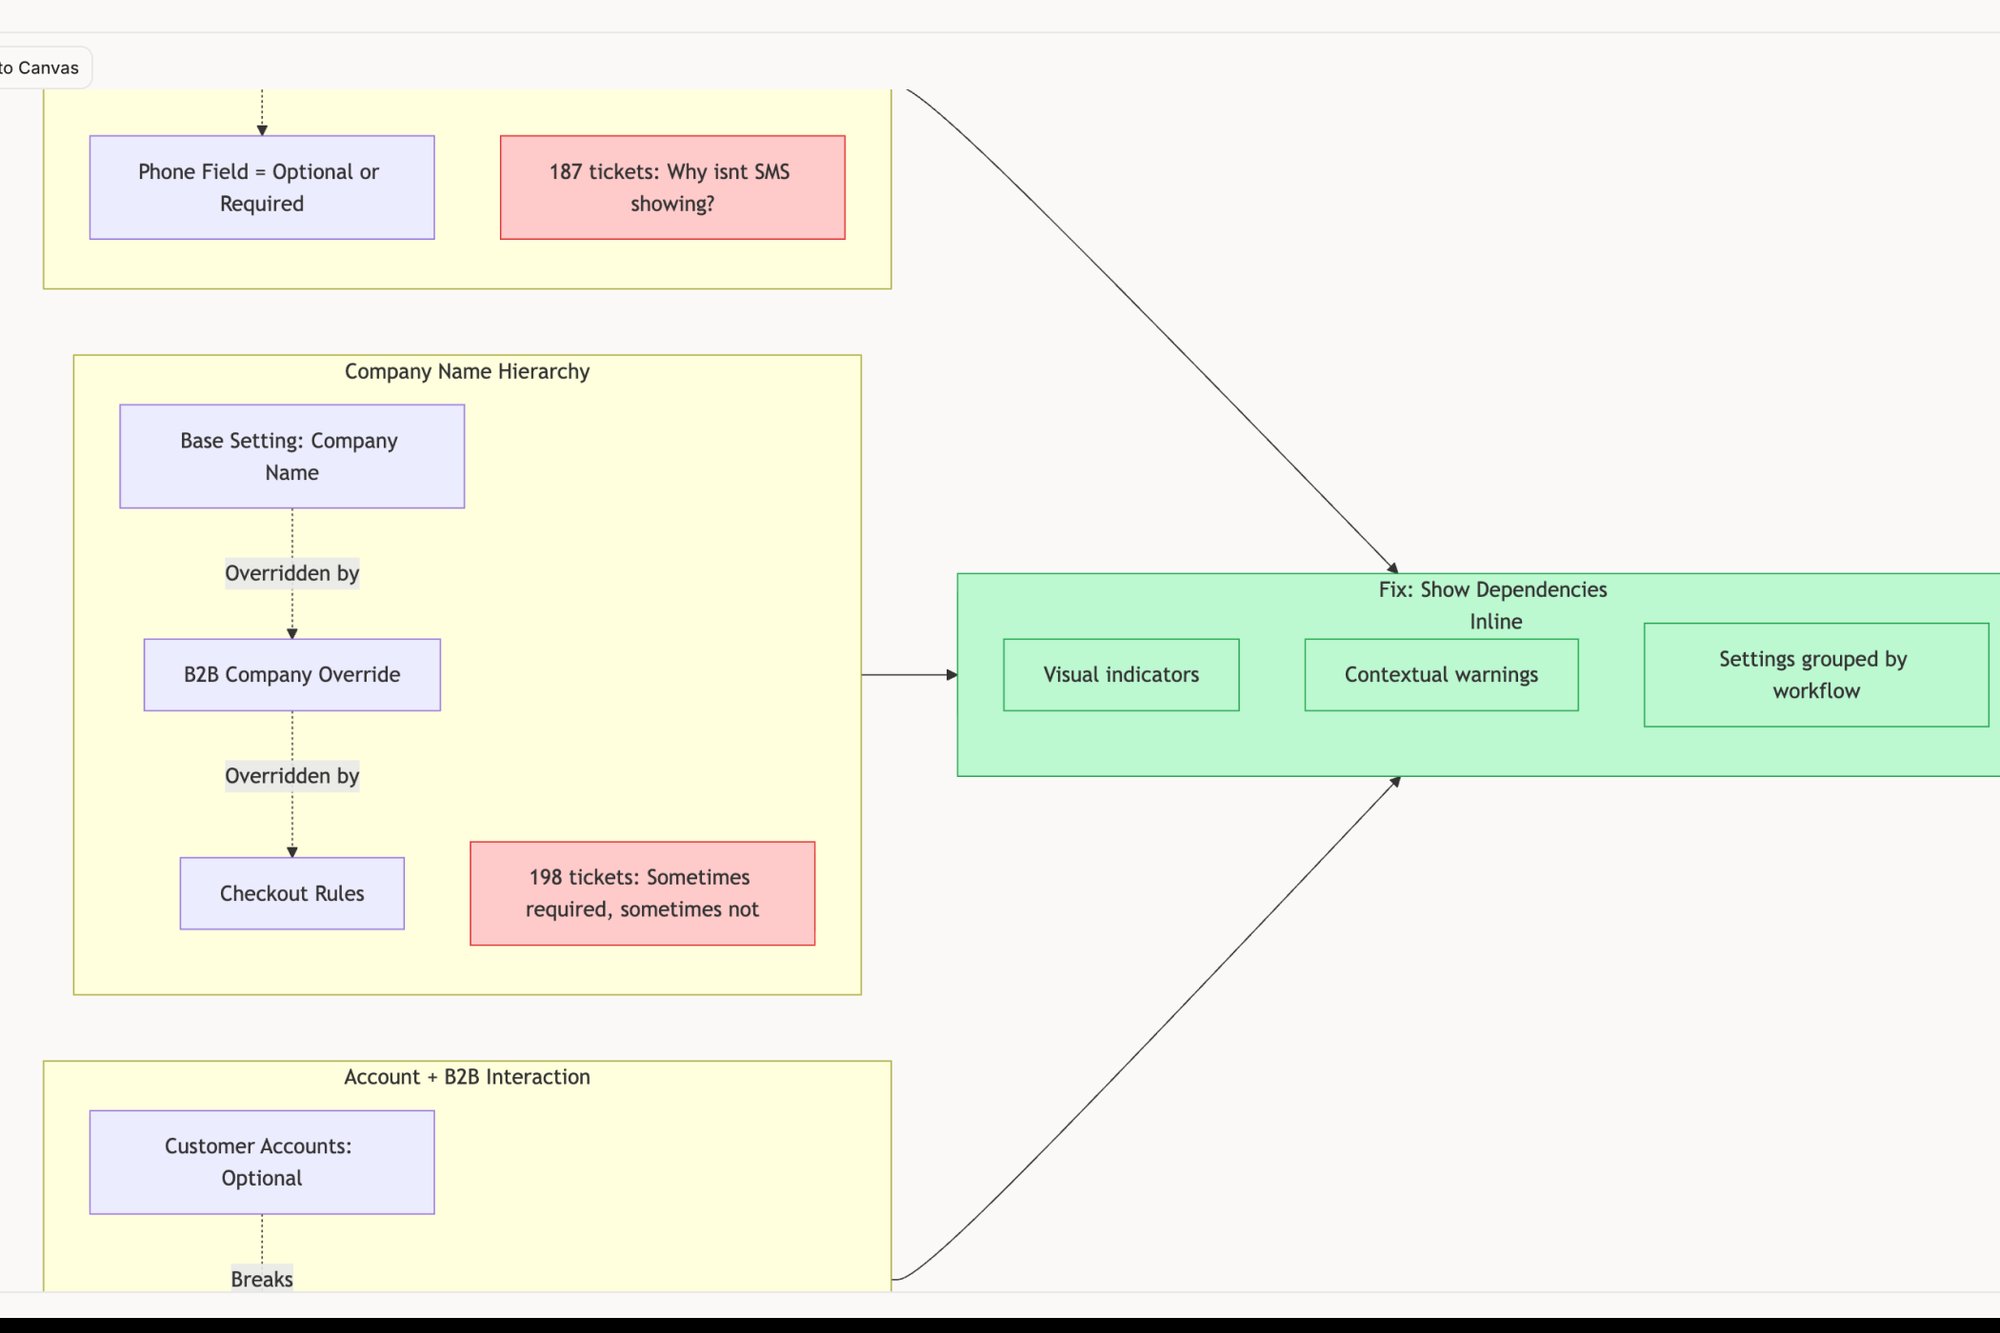
Imagine your product is a busy kitchen with multiple chefs. One chef changes the salt in the soup at the same time another adds a new spice. If the soup tastes better, which change was responsible? Or did they work together to create something new? This is the reality of a product with multiple teams running experiments. Failing to account for these interactions is one of the most common A/B testing best practices that teams overlook, leading to polluted data and false conclusions.
These interaction effects are the ghosts in your machine, subtly altering results in ways you can't see unless you're looking for them. A friend at a large e-commerce marketplace described their "experiment traffic cop" system. It was a central registry that prevented tests targeting the same user journey from overlapping. Before implementing it, they found that a "win" for a checkout button redesign was actually just benefiting from a simultaneous test that simplified the shipping options page, sending higher-intent users to the final step.
From Test Islands to a Connected Ecosystem
Treating each experiment as an isolated event is a critical error. The goal is to understand how changes affect the system, not just a single page. This requires a more holistic view of your experimentation portfolio.
- Isolated Test: We are testing a new banner on the homepage.
- Interaction-Aware Test: We are testing a new banner on the homepage, while the marketing team is running a traffic acquisition experiment that changes the user mix landing there. We must segment our results by traffic source to isolate the banner's true effect and document the concurrent experiment for future reference.
Tools like Figr can help map out these complex dependencies before a single line of code is written. By visualizing the complete user flow, like in this LinkedIn Job Posting analysis, you can spot potential collision points where different experiments might interact. This proactive mapping turns potential data contamination into a managed variable, ensuring the integrity of your results.
9. Validate Results with Bayesian or Replication Approaches
A single statistically significant result can feel like a finish line. You got the p-value under 0.05, the confetti drops, and the feature ships. But this is like judging a movie by a single frame: it’s a snapshot, not the whole story. A single test is vulnerable to randomness, timing, and the simple statistical noise of a dynamic user base. The most mature experimentation cultures treat a "win" not as a conclusion, but as a promising signal that requires verification.
This is where you move beyond the simple binary of win or loss. A product leader at Spotify once described their approach as building a "portfolio of evidence." They use Bayesian methods not just to get a single number, but to understand the probability distribution of potential outcomes. It answers a more useful business question: "Given our past experiments and this new data, what is the likelihood that this change will produce at least a 2% lift?" This incorporates historical context, turning each test into a cumulative learning opportunity rather than an isolated event.
From One-Off Win to Robust Confidence
Adopting this mindset means you build resilience into your product development process. It protects you from chasing statistical ghosts and making high-stakes decisions on flimsy evidence. It’s the difference between being lucky once and being consistently right.
- Replication: If a change is critical, run the exact same test again. Did it win a second time? A planned replication study, especially for a major feature like a checkout redesign, is one of the most powerful A/B testing best practices for confirming a true effect. DoorDash, for example, often replicates high-impact experiments across different markets or seasons to ensure the initial lift wasn't a fluke.
- Bayesian Analysis: Instead of a simple "yes/no" from a p-value, Bayesian methods provide a "credible interval" and a probability. You get a richer answer like, "There is a 92% probability that the true conversion lift is between 1.5% and 4%." This is far more intuitive for making business decisions than a p-value. It quantifies your confidence directly.
Tools that help map out complex user flows, like this Wise Card Freeze analysis, are invaluable for designing these robust validation tests. By understanding all the possible paths and states, you can design better, more targeted replication studies. True confidence comes not from a single test, but from a body of evidence that points in the same direction, a process that is as much about validation as it is about discovery. This layered approach is similar to how you would combine prototyping and usability testing to build confidence before a single line of code is written.
10. Implement Learning Systems for Continuous Optimization
A single A/B test is a snapshot. A continuous experimentation program is a motion picture, a system that learns and evolves. The impulse is to treat testing like a series of discrete projects: launch, measure, conclude, repeat. This is like building a series of campfires instead of a power grid. One provides temporary light, the other powers a city.
The goal is to shift from isolated tests to an integrated learning system. Companies like Netflix or Amazon don't just run experiments, they've built experimentation into the DNA of their product development. An engineering lead at Uber once described their system to me as "a conversation with the marketplace." They aren't asking one-off questions, they are in a constant, real-time dialogue, using algorithms to automatically route traffic to better-performing experiences while still exploring new ones.
From Sequential Tests to a Learning Engine
This approach moves beyond the simple "winner-take-all" model of a traditional A/B test. It embraces a more dynamic and efficient method for ongoing optimization, which is one of the most vital a/b testing best practices for mature product teams.
- Sequential Testing: Test A vs B, pick a winner. Then, test the winner (C) vs D. This is slow and leaves value on the table during each test period.
- Continuous Optimization: Use methods like multi-armed bandits to dynamically allocate more traffic to variations that are performing well, while still dedicating a small portion to exploring newer, unproven options. This minimizes regret, the cost of showing users a suboptimal experience, and accelerates learning. For high-stakes decisions, a traditional A/B test is still the gold standard for rigor. But for lower-stakes optimizations like headline or image variations, a learning system is far more efficient.
This creates a powerful feedback loop where insights from one test directly inform the hypotheses for the next, building institutional knowledge. You can learn more about how experiments become infinite and invisible with these advanced systems. By building the infrastructure for rapid deployment and analysis, you transform testing from a periodic event into a core, continuous function of the product.
From Guesswork to a System of Learning
We've walked through ten distinct A/B testing best practices, from writing a clear hypothesis to interpreting segmented results. Each practice represents a tool, a specific way to bring rigor to the chaotic process of building products people love. But if you zoom out, you’ll notice they aren't just ten separate tactics.
They are interlocking gears in a much larger machine.
That machine is a system of learning. The real goal is not to win more tests. It’s to stop having debates based on seniority and start having conversations grounded in evidence. It’s the institutional humility to admit, “I don’t know, but I know how to find out.” This fundamental shift transforms product development from a series of high-stakes bets into a portfolio of calculated risks, where even a "failed" test yields a valuable insight. It moves you from building features to building knowledge.
This is what I mean: A product team that internalizes these a/b testing best practices operates on a different level. They can de-risk a major launch by running a series of smaller, iterative experiments. A friend at a Series C fintech company told me how they used this approach to overhaul their entire onboarding flow, which you can see in a redesigned setup flow example. Instead of one massive, terrifying A/B test, they ran seven smaller ones over two months. Four failed, but the three winners combined to increase activation by 18%, a massive lift that would have been impossible to achieve with a single "big bang" release. They built conviction piece by piece.
In short, integrating these principles is about more than just product management excellence. It’s a core component of modern digital craftsmanship. Embracing A/B testing best practices elevates your product decisions and integrates seamlessly into a broader commitment to overall software engineering excellence, as detailed in these Top Software Engineering Best Practices, moving your team from guesswork to a robust system of learning.
So, where do you begin? The scale of it all can feel daunting.
Don’t try to implement all ten practices tomorrow. Your next step is much smaller. For the very next feature idea, before anyone writes a user story or opens a design file, simply write down a clear, falsifiable hypothesis. Just one. Define the change, the metric you expect to move, and the reason you believe it will work. This single, disciplined act is the gateway. It reframes the entire conversation from "what should we build?" to "what must we learn?"
And that is a question that builds great products.
Ready to move from theory to execution? Many of the artifacts shown, from generating test cases to simulating user flows, were created in minutes with Figr. Stop spending hours on manual documentation and start building your system of learning faster. Explore Figr and see how AI can accelerate your entire A/B testing workflow.
To put these practices into action, explore AI-driven A/B testing tools that generate smarter variants, or dive into the broader discipline of conversion rate optimization.