
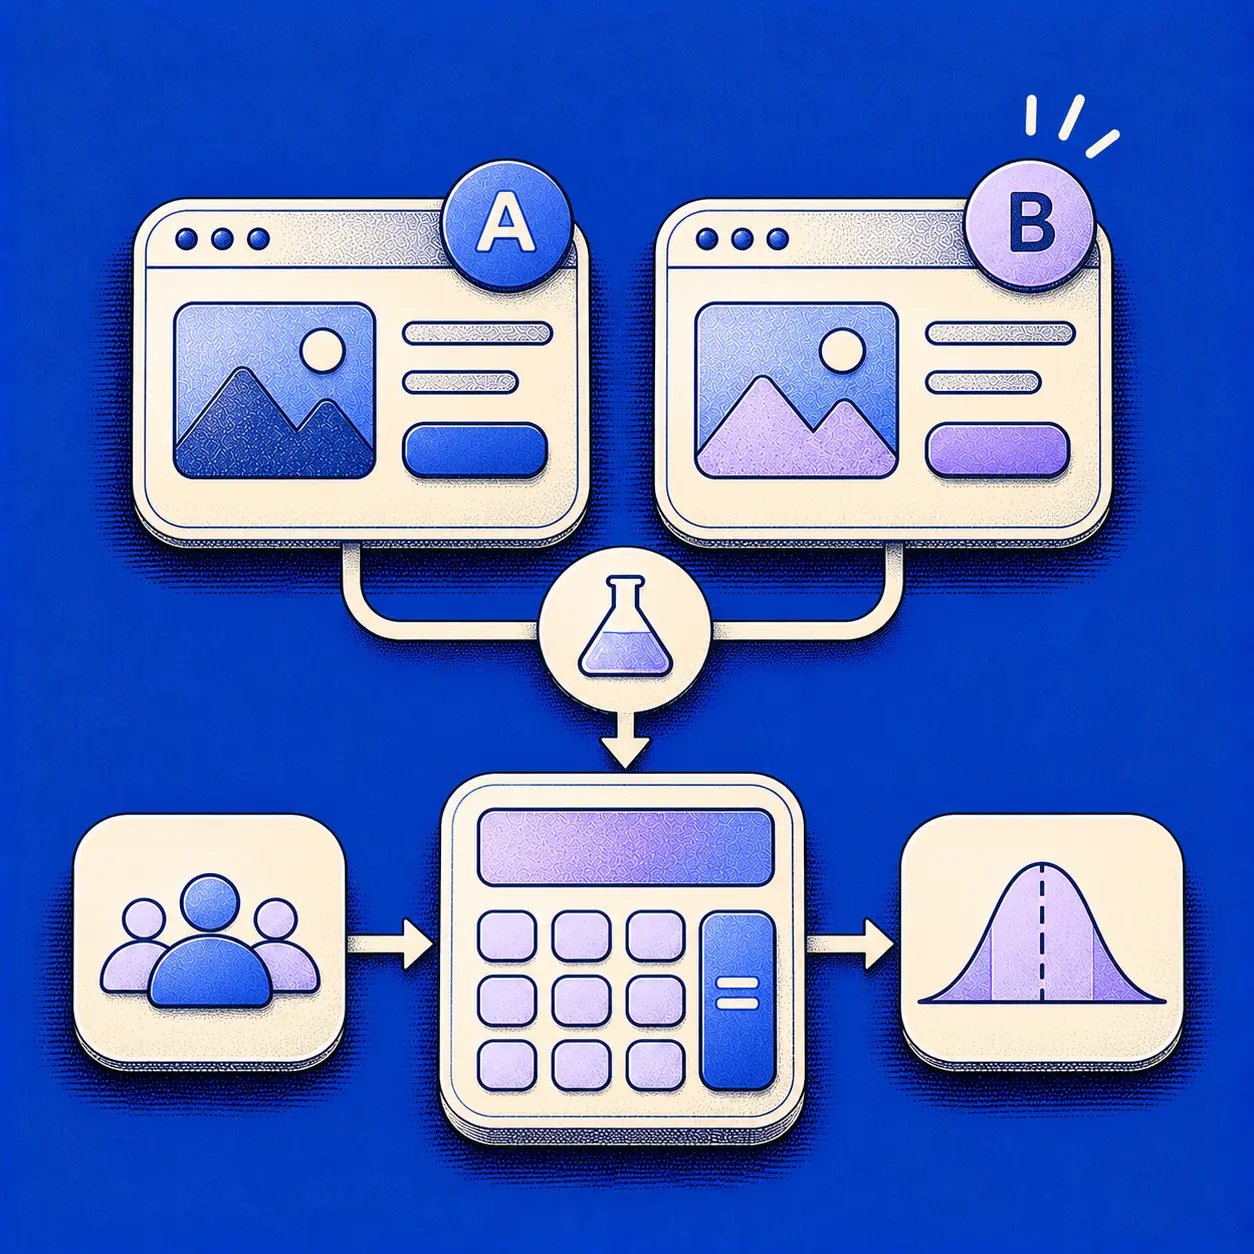
An A/B test is a sample size calculation with a dashboard bolted on, and many experimenters fall for the dashboard. The arrow goes green on a Wednesday, the room warms up, and someone asks whether you can ship it before the sprint ends. Nobody in that room knows how many users the test was meant to see before the first look was allowed.
That missing number is expensive. You ship a variant that beat noise, revenue stays flat for a quarter, and the next good idea gets waved away with "we tried that." The habit spreads too. If a team learns that a green arrow counts as a decision, they'll keep slicing segments until one of them turns green, and every false win teaches them the wrong lesson about their product.
The fix is smaller than the fear around it. You need one table, four inputs, a decision rule written before launch, and the discipline to leave the p-value alone until the end date arrives. This is the full calculation of an A/B test sample size, from picking the effect worth detecting to converting the number into a launch date a PM can defend.
Sample Size Table for Common Baselines and Lifts
Every A/B test carries a price in traffic, and the table below is the price list.
Each cell is users per variant for a two-sided test at 5% significance and 80% power, with an even traffic split. Absolute change is the baseline rate multiplied by the relative lift.
| Baseline rate | Relative lift | Absolute change | Users per variant |
|---|---|---|---|
| 2% | 5% | 0.1 points | 315,200 |
| 2% | 10% | 0.2 points | 80,700 |
| 2% | 20% | 0.4 points | 21,100 |
| 5% | 10% | 0.5 points | 31,200 |
| 5% | 20% | 1 point | 8,200 |
| 10% | 5% | 0.5 points | 57,800 |
| 10% | 10% | 1 point | 14,700 |
| 30% | 10% | 3 points | 3,800 |
Start with the 10% baseline and a 10% relative lift: 14,700 users per variant to catch a single point of movement. Now drop to a 2% baseline and the bill explodes. A 10% relative lift needs about 80,700 users per variant, and a 5% relative lift needs about 315,200. Same design, same confidence, roughly twenty times the traffic.
The pattern fits in one sentence: halving the detectable lift roughly quadruples the users required.
Multiply by arms, not by hope
Your total commitment is the per-variant figure multiplied by the number of variants. Two arms at 80,700 is 161,400 users before you get one answer, and every extra arm needs its own full allocation rather than a share of the same pile.
That single misreading, planning for the per-variant number as if it were the total, is why so many tests get called at half the power their owners believe they have. Which row do you land in, and does your traffic reach it?
Why 25,000 visitors isn't a rule
In 2024, Wingify's guide to A/B testing statistics reported that a test is considered significant after reaching 25,000 visitors, while noting that the appropriate sample size depends on baseline conversion rate, minimum detectable effect, confidence level and other factors. Both halves of that sentence matter. On a 30% baseline chasing a 10% lift, 25,000 users is generous. On a 2% baseline chasing 5%, it's a rounding error beside 315,200.
Traffic counts also get fudged in one direction. Teams quote sitewide sessions when the test runs on a single step, so the eligible pool is a fraction of the number in the slide. If your experiment sits on a signup flow, the only sessions that count are the ones reaching that step. That is the same counting discipline a team applies when moving SaaS users from signup to paid: a funnel is a chain of gates, and your sample is whoever makes it through the gate you are changing.
When the traffic can't reach the row, you have three honest levers: widen the MDE, cut an arm, or accept lower power. The last one does shorten the test, and the cost is a larger chance of missing a real effect, so spend it last.
Find the row closest to your own baseline and lift, round up, and stop negotiating. When your numbers fall between rows, run the full calculation rather than splitting the difference.
Choosing an MDE Your Business Can Act On
The formula will accept any minimum detectable effect you hand it, which is why the interesting decision happens before the calculator opens. Ask what the smallest effect worth detecting is for this decision. That answer comes from expected business value, implementation cost, the harm a bad variant does to users, the retention effect you can't see inside a two-week window, and how quickly you could reverse the rollout.
Three thresholds sort almost every test:
- Below the floor, don't test. A change too small to justify engineering and UX work doesn't need an experiment. It needs a decision and a guardrail.
- At the level that justifies a rollout, you've found your MDE. Write that number down with the reasoning attached.
- Between the two, you're buying learning. Treat the result as input to the roadmap, not as a shipping argument.
Then the levers. Each row changes one input and holds the rest steady:
| Input | Change | Effect on users per variant |
|---|---|---|
| MDE | Halve the effect | About 4x more users |
| MDE | Double the effect | About one quarter of the users |
| Power | 80% to 90% | About 34% more users |
| Significance | 5% to 1%, two-sided | About 50% more users |
| Baseline | 2% to 5% at the same 10% relative lift | Falls to less than half, because a higher baseline has more room to move |
The trap that follows a big sample
Large samples make negligible changes statistically significant. On a high-traffic page you can prove a half-point lift with total confidence and still be unable to justify the build, because the effect is smaller than the cost of shipping it. Compare the confidence interval against a practical-impact threshold you declared before launch, not the p-value alone.
A Northeastern FIT guide to experiment design and sample size makes this concrete: halving the detectable effect requires roughly four times the sample, so teams either demand a lift their audience can never resolve or accept a significant result too small to earn the engineering time. Is a statistically significant half point worth a quarter of your team's capacity?
Practical rule: put the practical-impact threshold in the same ticket as the sample size. If the confidence interval sits under that threshold, you have a result, not a reason to ship.
The same guide makes a point worth stealing for smaller SaaS products. A test can be statistically underpowered yet still inform a low-risk staged rollout when the observed effect is directionally consistent and guardrails stay safe, provided nobody dresses it up as proof of causation. The distinction is between evidence for deployment and evidence for causal certainty, and most sample-size content collapses the two.
Before launch, assign four possible outcomes so the result lands somewhere instead of drifting into another meeting. Ship when the interval clears your practical threshold and guardrails held. Iterate when the direction is right and the size is unresolved. Keep collecting evidence when the effect is plausible but the interval is wide. Reject when the interval sits below the threshold you declared. Pick your guardrails with equal care, and Figr's guide to UX metrics is a decent shortlist of the ones that move with real behavior.
How to Calculate Sample Size in Five Steps
Here's the sequence to drop into a ticket before anyone writes test code. The infographic condenses it; the steps below carry the reasoning and the mistake that usually creeps in.
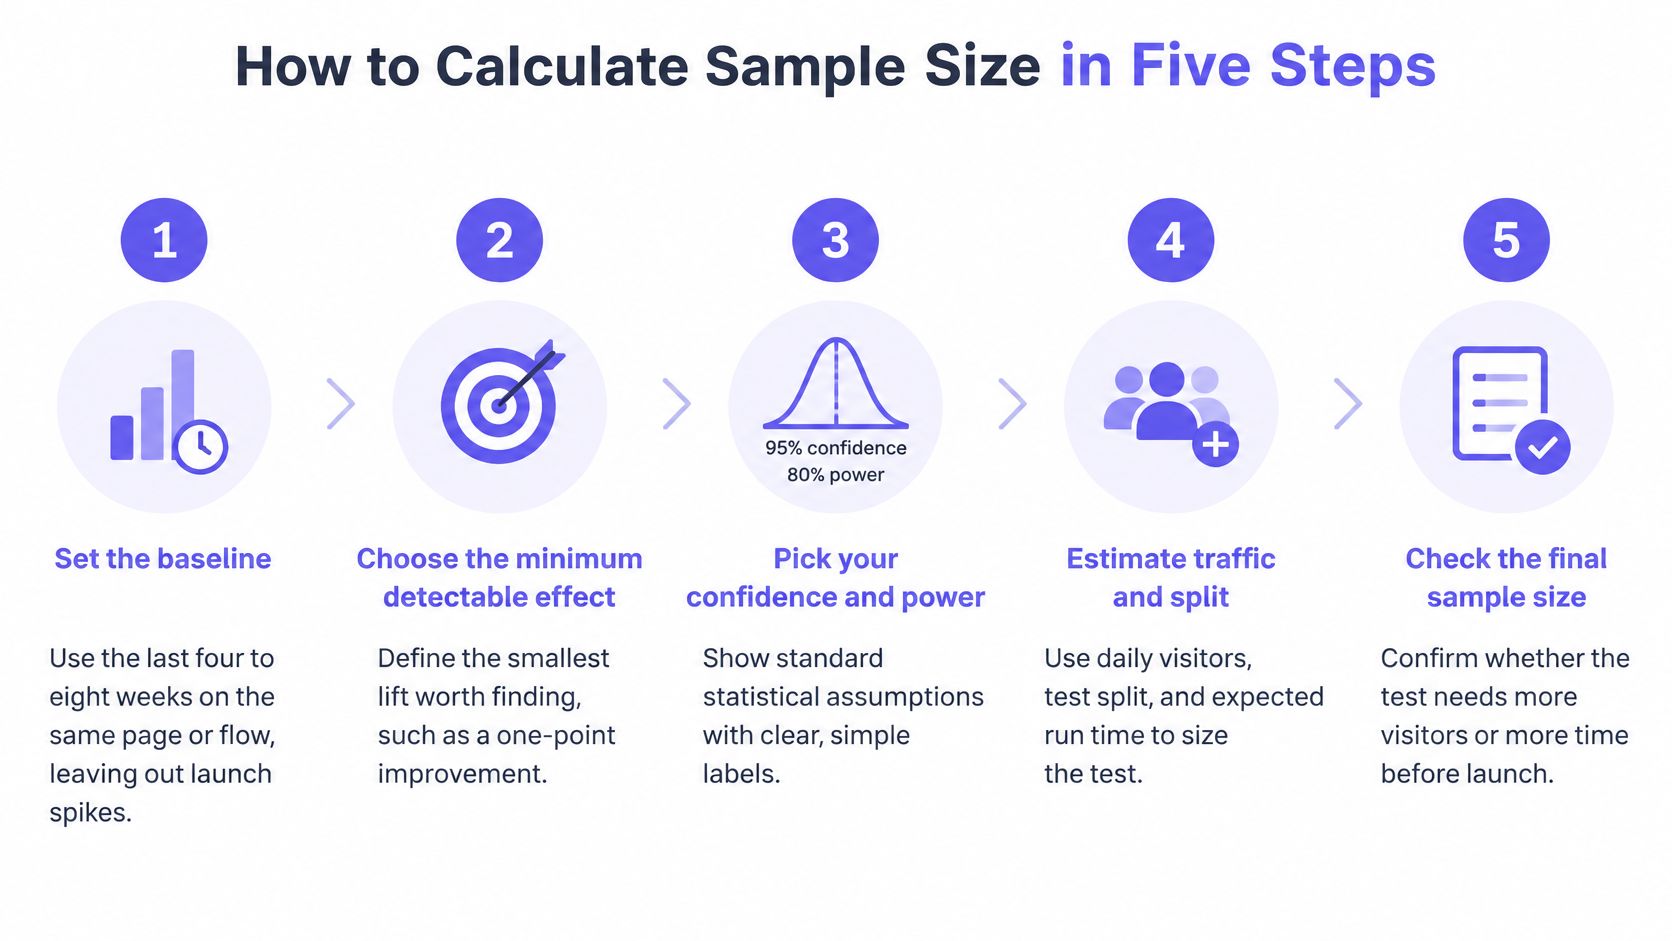
- Set the baseline from the same page. Pull the last four to eight weeks of the metric on the exact page or flow being tested, not a sitewide average. Leave out launch spikes, holiday weeks and outages. The common slip is averaging a noisy month and calling it a stable baseline.
- Choose the minimum detectable effect. Pick the smallest change that would alter a decision, and write one sentence defending it in business terms. The slip is choosing a round number like 5% without checking what it costs in traffic.
- Fix significance and power. Use 0.05 two-sided and 0.80 power, which gives z values of 1.96 and 0.84 and a squared sum of about 7.85. The slip is dropping to 0.70 power to shrink the number, which buys speed by making real effects invisible.
- Run the arithmetic. Users per variant equals p1 times (1 minus p1) plus p2 times (1 minus p2), all multiplied by 7.85 and divided by the absolute difference squared. A 2% baseline chasing a 10% relative lift returns about 80,700 per variant, which is the check that keeps you honest. The slip is mixing relative and absolute effects between the calculator and the ticket.
- Convert to calendar time. Multiply by the number of variants, divide by daily eligible users, and round up to full weeks so weekday and weekend behavior both appear. The slip is dividing by total daily traffic when a chunk of it never reaches the test.
The input you never trade away
What happens when the days exceed the quarter? You change the MDE or you change the design. Power stays where it is, because trimming power doesn't shorten the test, it just hides the result you were paying for.
A shorter test that can't see the effect you care about isn't a faster decision. It's a more confident non-answer.
A Worked Example From Baseline to Runtime
Say a SaaS product has 3,000 daily visitors on its signup page, split evenly, with a baseline signup rate of 8%. The team wants to know whether a new headline lifts signup by a full point, taking 8% to 9%, a 12.5% relative change.
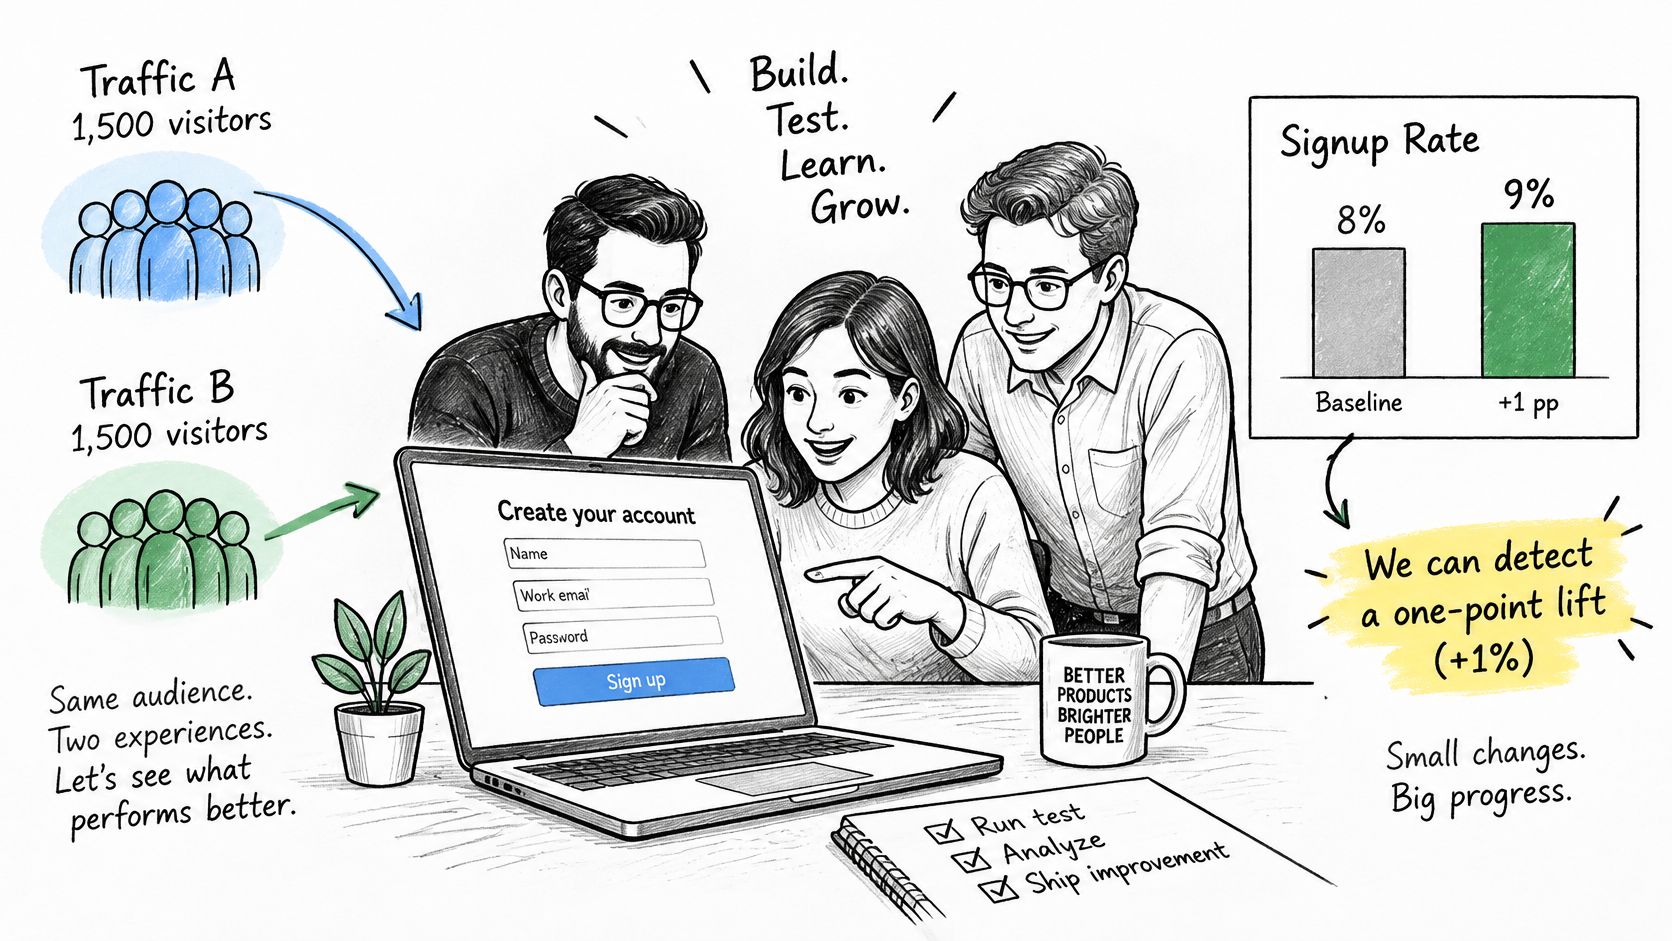
Run the formula and the arithmetic stays visible enough to check by hand. 0.08 times 0.92 gives 0.0736, 0.09 times 0.91 gives 0.0819, and the sum is 0.1555. Multiply by 7.85, divide by 0.0001 (the square of the one-point difference), and you need about 12,200 users per variant.
At 1,500 visitors per variant per day, that is 8.1 days. Round up to two full weeks so weekday and weekend behavior both show up, and the end date exists before the first user is assigned.
Now the team asks what a half-point lift would cost. Same formula: 0.08 times 0.92 plus 0.085 times 0.915, multiplied by 7.85 and divided by 0.000025, returns about 47,500 users per variant. At the same 1,500 a day, that is roughly 32 days, which rounds to five full weeks. The per-variant count nearly quadrupled and the raw runtime quadrupled with it; after rounding to full weeks, two weeks becomes five. The sharper question carries a sharper bill, and here it buys a result the team already said it would not act on, because a half point does not cover the build.
Traffic share changes the answer without changing the math
A 2024 arXiv study of online experiment duration treats sample size as a central design choice and evaluates experiments that enroll 1%, 10% and 50% of all users. On our 3,000-visitor page, 12,200 per variant at a 50% split is about eight days. Hold the same test to 10% of users and you're enrolling 300 per variant per day, so the identical user count now stretches past a month. The sample size didn't move. The enrollment did.
Test duration is a business input, not a scheduling detail. A worked example published in The American Statistician estimated that detecting a 5% revenue change with 80% power at a 5% significance level required 147,456 users per variant. Revenue per user swings far more than a binary signup, so the count climbs to a scale where only a large company with patient stakeholders can run the test properly. Scale buys precision, and precision on a noisy metric is never cheap.
Paste this template into the test ticket and fill the blanks:
- Baseline: 8% on the signup page, four weeks excluding the pricing announcement.
- MDE: one point, because a half point doesn't cover the build.
- Users per variant: 12,200.
- Daily users per variant: 1,500 at a 50% split, 300 at a 10% enrollment share.
- Days and end date: round up to two full weeks, ending on a Sunday night.
If you want bigger swings to test, the same planning discipline pairs well with practical techniques for boosting conversion rates that aim at larger effects rather than cosmetic ones.
Why Checking Results Early Inflates False Wins
A pricing page test is designed for 21 days. On day three the variant shows p = 0.03 on the primary metric, and the PM ships it to everyone. The number feels like proof. It's a coin landing heads on the third flip and being awarded the whole match.
A fixed-horizon sample size assumes exactly one look at the end. Every peek is another chance to catch noise on an upswing, and every extra segment is another lottery ticket you didn't budget for. How many chances to be wrong do you want to buy?
The teams with the least traffic have the strongest incentive to monitor continuously and stop early, which is the worst combination available. A 40-person SaaS product checking the dashboard hourly is running a different, more error-prone test than the one it designed, and it's doing so with the fewest users to spare.
A methodological review of sequential A/B testing frames the problem precisely. Repeated checks, changing target segments, and several metrics or variants at once create multiple-comparison and false-positive risk, and standard sequential methods may not fit subgroups that shift during the test, where customized decision thresholds and sample sizes can be required. Running until significance isn't an efficiency tactic. It changes the statistical problem.
A test that runs until it looks good isn't a longer test. It's a different question with a friendlier answer.
The fixes are unglamorous. Use a preplanned sequential design or always-valid inference when live monitoring is required, and keep exploratory monitoring clearly separate from confirmatory analysis so nobody promotes a dashboard glance into a decision. Then separate the two kinds of segment work: confirmatory segments you named in advance, exploratory ones you learn from and re-test.
Write these five lines before the first user is assigned:
- The stopping rule. Fixed sample, or a named sequential method.
- The interim-look schedule. Which days, and who is allowed to look.
- The primary metric. One, declared, with the decision attached to it.
- Secondary metric treatment. Context and hypothesis generation, never winner declarations.
- Segment status. Each slice marked confirmatory or exploratory before launch.
If your team keeps finding winners that evaporate two months later, avoiding false winners in A/B testing is worth reading alongside this section, and A/B testing best practices covers the operating habits that keep a program honest once the rules exist.
Confirm Your Sample Size Before You Launch
The last step is the cheapest one: a pre-launch check that takes ten minutes and prevents most of the waste described above. Fill in five lines and read them out loud.
- Baseline, plus the window it came from and what you excluded.
- MDE, plus the one sentence explaining why a smaller effect isn't worth shipping.
- Significance and power, stated as numbers so nobody assumes a default.
- Users per variant, with the arm count multiplied through.
- End date, set in full weeks, in the calendar, with an owner.
Any standard two-proportion sample size calculator will match the formula in the five steps when the inputs match. A spreadsheet beats a calculator for repeat use, since you can keep a row per test and compare planned enrollment against actual enrollment after the fact, which is how you find out whether your traffic estimates were ever real.
Where calculators disagree is in the choices nobody writes down. A one-sided test buys a smaller sample by ignoring the possibility that the variant is worse, which is rarely the risk you want to take on a pricing page. An uneven split changes the per-variant requirement in ways the ticket never records. Write the choice next to the number, or the next person to open the file will assume the default.
Figr earns a place in the workflow, with a limit worth stating plainly. Figr turns analytics signals into testable UX questions about why users drop, what they may not understand, which states deserve review, and what product evidence is missing. It cannot tell you exactly why users drop off, so treat its analytics context as a source of hypotheses to pair with research and team judgment. It fits this step when you're reviewing flows and edge-case states before a test, and a product team's guide to safer shipping helps you decide which guardrails belong in the ticket before you need them.
In short, the discipline lives in planning, not analysis. The analysis is the easy part once the plan exists.
Three actions for this week. Calculate your row today using the first table, before the next test idea gets a meeting. Lock the five lines in the ticket so the decision rule exists in writing. Launch only when the end date is fixed, because if nobody can name the day the test ends, it isn't scheduled. It's open-ended monitoring with a hypothesis attached, and that's how the false wins get in.
Figr helps product teams turn analytics signals into testable UX questions and the artifacts a test needs, from user flows to edge cases to the guardrail metrics that decide what ships. If you're planning your next experiment and want the hypothesis grounded in your own product context instead of a generic template, start on the free plan and run one workflow end to end. Visit Figr to see how it fits the next test on your roadmap.