
A PM opens Monday's dashboard, sees signups up again, and still can't answer why paid accounts are flat. The conversion funnel is broken somewhere between visit and renewal, but the headline numbers only confirm that a leak exists.
When that leak stays unnamed, teams spend on more traffic to refill a bucket that's still losing water. Acquisition looks busy, activation stalls, and revenue forecasts drift because nobody can point to the stage where qualified users stop moving.
The fix starts with treating the funnel as a measurement system. Each stage needs one event that proves it happened, one window for counting it, and one owner who checks whether the next change moved people forward.
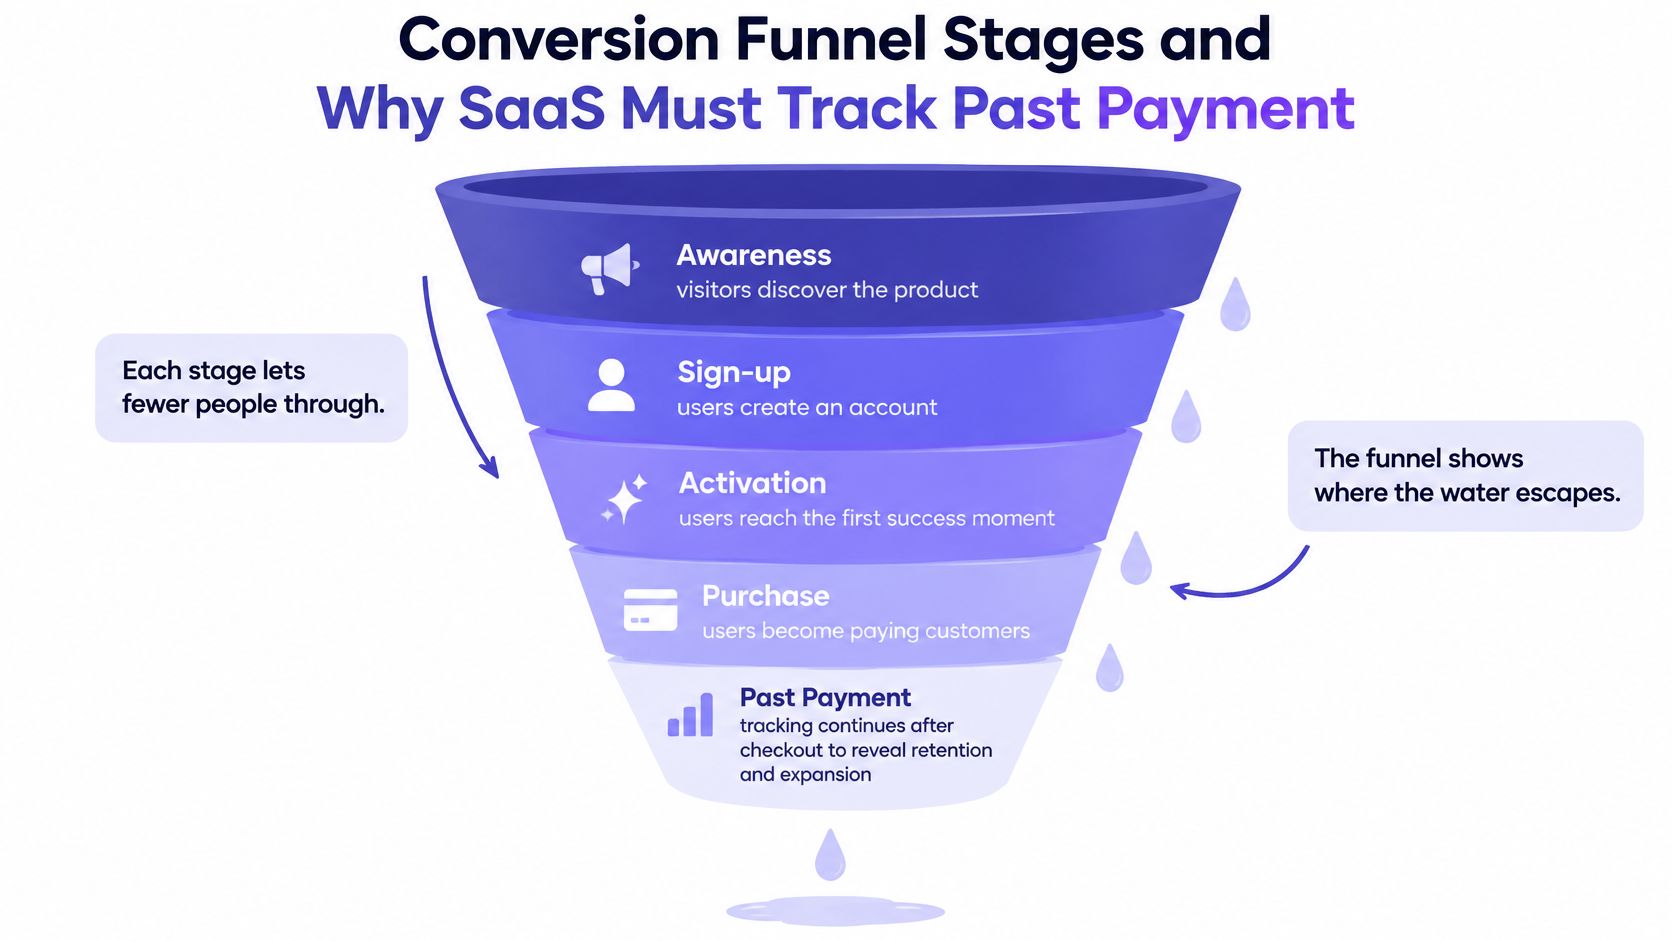
Conversion Funnel Stages and Why SaaS Must Track Past Payment
A signup count can rise while the number of users reaching a first useful outcome stays flat. That gap is easy to miss if the funnel ends at registration or payment.
A conversion funnel is an ordered set of user stages, with a measurable event that shows when someone advances from one stage to the next. The event matters as much as the stage name: “activation” is only useful if the team can identify the action that demonstrates it.
The SaaS stage map
| Stage | What the user does | Metric to track | Example event |
|---|---|---|---|
| Awareness | Lands on a page or sees an ad | Visits by channel | Landing-page visit |
| Interest | Reads features or pricing | Click-through to signup | Pricing page view |
| Consideration | Compares plans or starts a trial | Trial start rate | Trial started |
| Activation | Completes a defined first-value action | Signup-to-activation rate | First project created |
| Conversion | Pays or upgrades | Trial-to-paid rate | Paid subscription started |
| Retention | Continues using the product | Continued-use rate | Second-month login |
| Advocacy | Refers others or adds seats | Referral and expansion rate | Invite sent |
Each stage answers a distinct question. Awareness measures whether people arrive; activation tests whether they reach a useful outcome; retention shows whether that outcome leads to continued use. The same measurement logic applies after payment as before it.
The stage model has a long history. The Equinet Academy guide to conversion funnels traces it to Elias St. Elmo Lewis, who described attracting attention, maintaining interest, and creating desire in 1898. It also notes that C. P. Russell coined AIDA in 1921, after the action step was added.
The labels have changed; the analytical task has not. Teams need to define what progression means in their product and choose an event that can demonstrate it.
Why payment is a midpoint for SaaS
Payment confirms a transaction, not lasting customer value. A product may record a new subscription without showing whether the user completed setup, reached a first useful outcome, returned, renewed, or expanded. Those later stages need observable events too.
For example, a month with more signups does not establish that activation improved. If the team cannot count users who completed a meaningful first action, the signup total leaves that question unanswered.
Naming rule: If you can't name the event that proves a stage happened, you don't have a stage yet. You have a label.
The same outcome-based discipline appears in sales offers that pay only when SaaS deals close. Inside the product, teams can design onboarding flows that reduce churn around a defined activation outcome, then track whether users reach it.
A useful starting point is to list the stages in your product and name the event that proves each one. Give activation and retention the same measurement attention as signup and payment.
How to Instrument Your Funnel Step by Step
Good instrumentation turns opinion into a checkable sequence. Bad instrumentation produces a colorful chart that no one trusts. Which one does your team have when marketing, product, and engineering pull different counts for the same week?
The six-step workflow
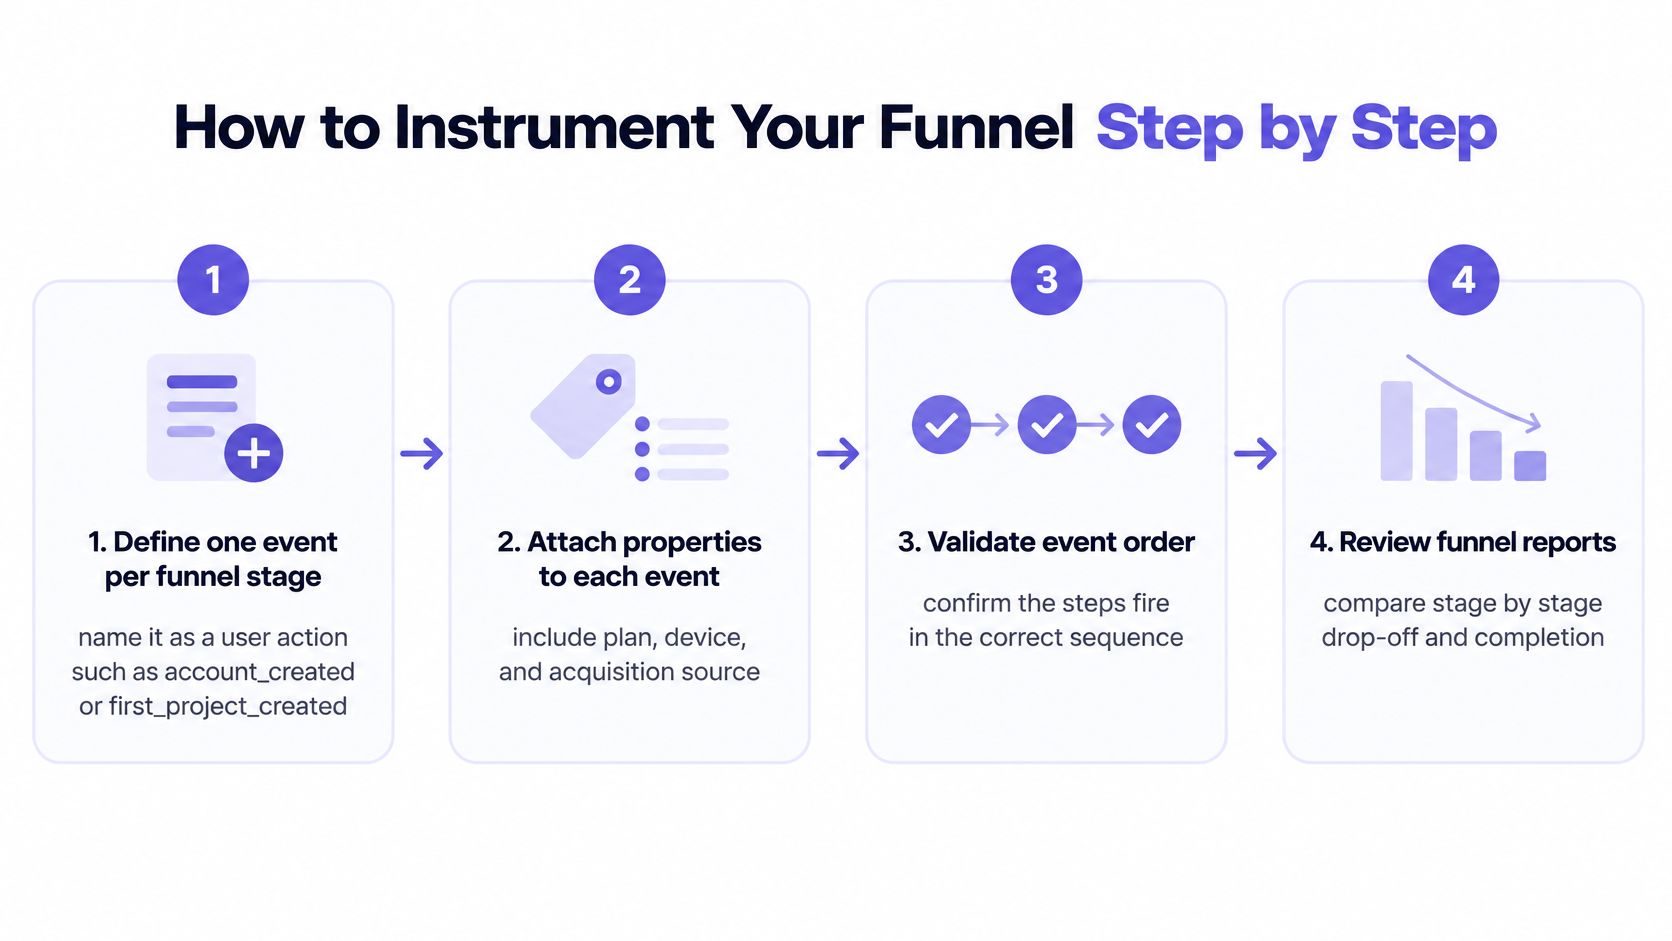
Step 1. Define one event per stage.
Name it as a user action, such as account_created or first_project_created.
Avoid page names when the milestone is an action.Step 2. Attach properties to every event.
Include plan, device, acquisition source, user role, and company size.
You'll need those cuts the first time a total moves and nobody knows why.Step 3. Set a window and a stable identity.
Give activation a clear window, such as seven days from signup.
Link events to a stable user ID so each person counts once.Step 4. Add performance telemetry.
Join load-time buckets, Core Web Vitals, device class, and network type to behavioral events.
Google's mobile page speed benchmarks found that increasing load time from 1 to 10 seconds raised the probability of a mobile bounce by 123%.Step 5. Build the weekly cohort report.
Compare users by the week they entered the funnel.
Split by source and device before you compare periods with different traffic mix.Step 6. Verify with a manual test path.
Walk the funnel on staging with a fresh account.
Confirm every event fires once, in order, with the right properties.
Why does speed belong in a funnel report rather than an engineering dashboard? A slow first screen removes users before intent can appear. Downstream copy tests can't recover sessions that never reached signup.
The basic gist is this: events tell you what happened, properties tell you for whom, and performance data tells you under what conditions. Teams evaluating attribution options can use Docket's research on Factors alternatives as context for how tooling choices shape what gets counted. Whatever you choose, avoid common UX measurement mistakes such as changing definitions mid-quarter and then comparing the trend as if nothing shifted.
Run one manual walk through the funnel and compare your actions with the dashboard counts. If they don't match, fix tracking before you debate tactics.
Calculating Step Conversion With One Worked Example
Take one illustrative SaaS funnel for a single week. Say a product records 1,000 landing-page visits, 240 trial starts, 150 completed onboardings, and 60 paid subscriptions.
Step conversion equals users who reach a stage divided by users who entered the previous stage during the same window. Trial start is 240 divided by 1,000, or 24%. Activation is 150 divided by 240, or 62.5%.
Paid conversion is 60 divided by 150, or 40%. Overall visit-to-paid conversion is 60 divided by 1,000, or 6%. Which number would you put in the board update, and which one tells the product team where to work?
Reading the losses
The absolute losses tell a second story. The funnel loses 760 users before trial, 90 during activation, and 90 between activation and payment. The largest leak sits at the top, yet the activation step may hold cheaper recoverable revenue because those users already started a trial.
That's the analyst's distinction. A weak rate with a large base can matter more than a weak rate with a small base. Rank stages by recoverable users, not by embarrassment.
The window rule and the cohort rule
Windows change the answer. If activation must happen within seven days, a user who finishes onboarding on day nine falls outside the count. The product may have helped that user, while the report says activation failed.
- Window rule: State how long a user has to complete each step.
- Cohort rule: Count each user once, grouped by the week they entered.
Run this arithmetic on your own counts for the two stages you care about most. Write the numerator, denominator, and window beside each rate. Can another person reproduce your number from those three lines?
Reading Conversion Benchmarks Without Misjudging Your Funnel
A benchmark is a reference point, not a verdict. A funnel is a measurement system: each stage is only as informative as the event that proves a user reached it. That applies to activation and retention as much as to signup and payment.
| Benchmark | Reference value | What it covers |
|---|---|---|
| Unbounce 2024 median landing-page conversion | 6.6% | 57 million conversions, July 2023 to July 2024 |
| Unbounce 2024 median range across nine industries | 3.8% to 12.3% | One median per industry |
| Baymard average cart abandonment across 50 studies | 70.22% | Documented rates from 55% to 84% |
| Baymard 14-year program average cart abandonment | About 70.19% | About 3 in 10 initiated carts reach purchase |
| Cart abandonment, mobile versus desktop | 85.7% versus 73.8% | Cart abandonment rates by device, as summarized by Lightly Salted |
What each reference can and cannot say
Unbounce's 2024 Conversion Benchmark Report as summarized by Ideatool recorded a 6.6% median landing-page conversion rate across industries, based on 57 million conversions from July 2023 to July 2024. Unbounce's 2024 Conversion Benchmark Report reported median landing-page conversion rates across nine industries ranging from 3.8% to 12.3%.
A landing page converting at 5% may be above or below its relevant comparison point. Industry, offer, and traffic source affect what the benchmark can tell you; the range is a reminder that one median cannot grade every page.
Baymard's cart abandonment compilation reports an average abandonment rate of 70.22% across 50 studies, with documented rates ranging from 55% to 84%, and cautions that no universal good rate exists. Lightly Salted's summary of recent benchmark data reports cart abandonment of 85.7% on mobile compared with 73.8% on desktop. Treat the device split as a comparison to investigate, not a target for every product.
Statista's app subscription conversion data reports that free trials converted to paid subscriptions at higher rates than direct-purchase funnels across app categories from 2024 to 2025. That supports testing a trial path, but does not predict results for a particular category, price, or activation experience.
Define each event consistently, then compare your own segmented trend with the benchmark. A four-week baseline can help show whether a change affected conversion by device or source. Teams setting guardrail metrics for product teams can also track whether a conversion gain coincides with weaker retention or more support tickets.
Finding Where Users Drop Off and Why
An aggregate conversion rate shows the size of a loss. It doesn't explain the cause. Why do teams keep debating the headline rate when the useful argument sits one stage deeper?
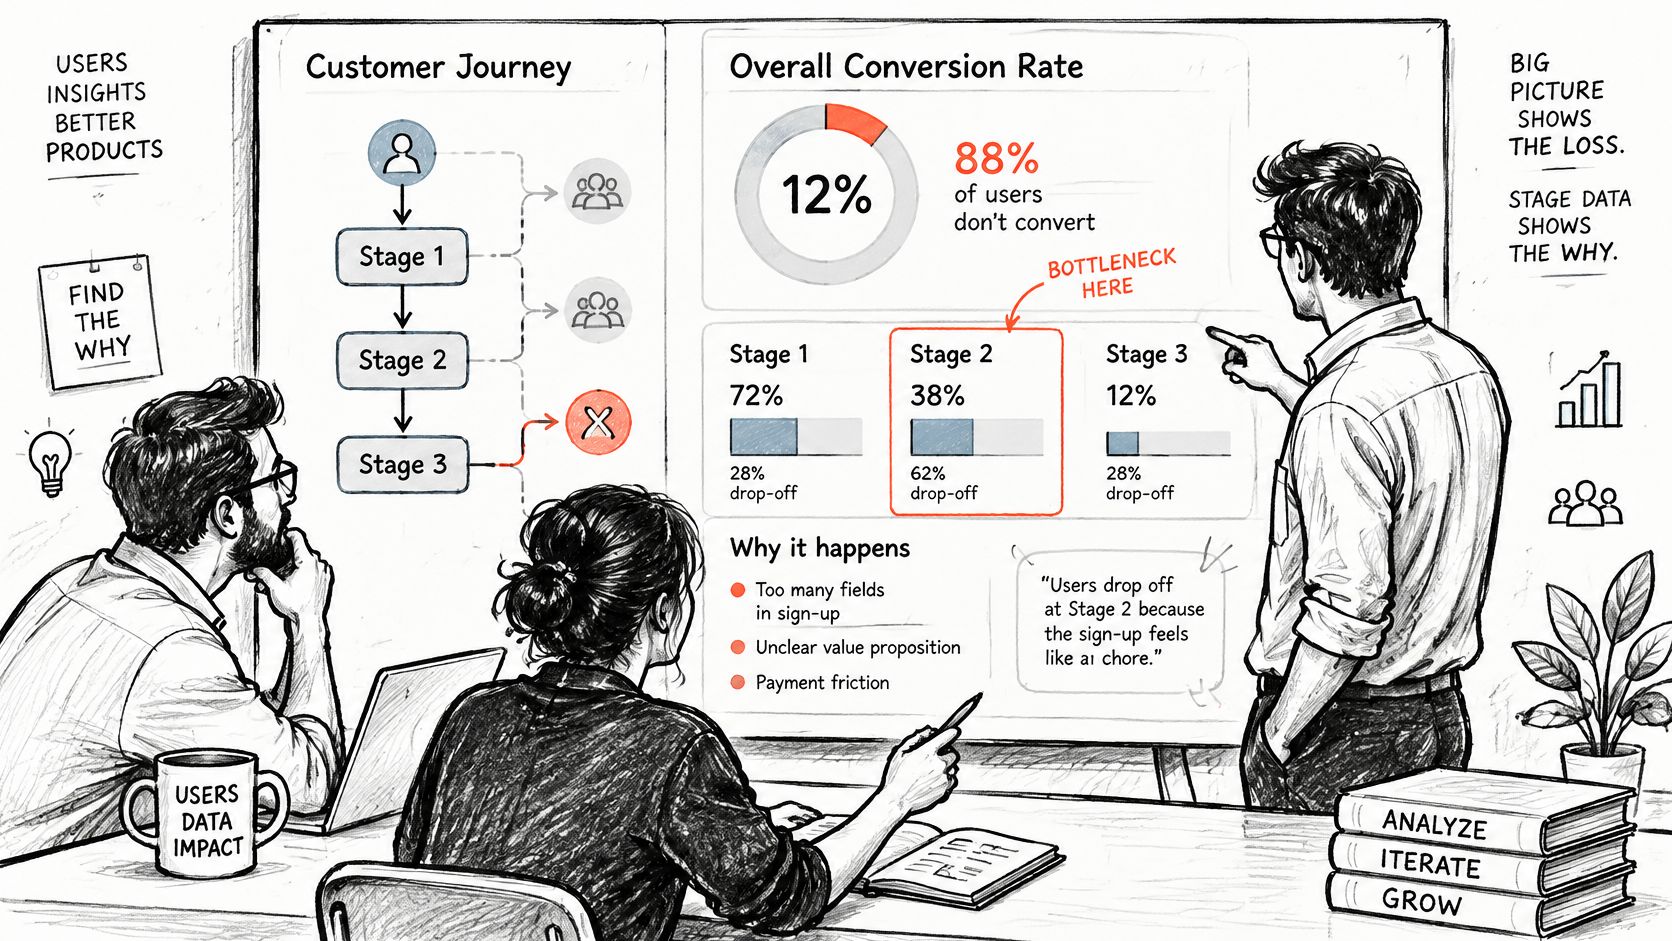
Match the pattern to the first check
| Drop-off pattern | Likely cause | Check first |
|---|---|---|
| Traffic lands but few start signup | Message mismatch or slow first screen | Load-time buckets and acquisition source |
| Signup started, not finished | Too many required fields or no reason given | Field-level abandonment and error rates |
| Account created, no first action | Empty states or unclear next step | Session recordings and time to first action |
| Trial ends without payment | Value not reached or price surprise | Trial-to-paid split by activation status |
| Mobile far below desktop | Layout or checkout friction on small screens | Device split at each funnel step |
| Users leave after an error | Unclear error message or missing form label | Error logs and accessibility checks |
Baymard Institute's checkout usability research reports that 65% of sites have checkout performance rated mediocre or worse, while 48% of surveyed U.S. shoppers cited excessive additional costs such as shipping, taxes, or fees. Watch cart creation to checkout start, payment completion, and order confirmation as separate transitions. Each one helps separate weak demand from avoidable interaction friction.
Pair counts with evidence from the moment of exit. Session recordings show hesitation, rage clicks, and fields users revisit. Short abandonment surveys reveal price surprise, missing information, and trust concerns that event data can't name.
Could the same drop have two causes in two segments? Yes, and that's why device, source, and activation status belong in the first cut. Teams that uncover what users truly need treat behavior as a question generator, then validate the answer with research.
The honest limit
Figr can turn analytics files, funnel notes, and product behavior signals into hypotheses about why users drop, which states may need review, and which evidence is missing. It cannot tell exactly why users leave. Each hypothesis needs checking against research, product context, and team judgment.
Evidence rule: A funnel chart can locate the exit. It cannot interview the person who used it.
Find the row that matches your largest loss. Run its first check this week, before anyone proposes a redesign.
Tactics That Lift Each Funnel Stage
A funnel stage is useful only when its completion event proves that the intended behavior occurred. For awareness, that might be a qualified landing-page visit; for activation, a user completing the action that first demonstrates product value. Match the intervention to the stage, then check whether its proving event changes.
Stage-specific fixes to test
- Awareness: Match the landing-page message to the ad or search query that brought the visitor in.
- Interest: Put pricing and the main use case where visitors can judge fit before they commit to a signup.
- Consideration: Place relevant proof near the trial or signup action, where it can inform the decision.
- Activation: Replace an empty dashboard with a first-run path that prompts one specific action.
- Conversion: Show price and cancellation terms before payment, while the user can still decide.
- Retention: Trigger a message when a user misses the first expected return window.
Each tactic needs its own completion event. A signup does not prove activation, and a payment does not prove retention. Choose the next test where a small interaction may be creating friction despite strong intent.
The unexplained-obligation effect
A required form field can introduce friction when users do not understand why it is needed. A phone-number request at checkout is one example: the user must weigh sharing personal information against completing the purchase.
Test three versions with the same cohort: remove the field, make it optional, or keep it required and explain its purpose, such as sending delivery updates. Compare checkout completion, field errors, and time to finish by device. The result can show whether the field itself, its required status, or the lack of explanation is associated with abandonment.
Teams seeking to improve conversions with AI-enabled experiments still need a clear test design: generating variants does not prove that one caused a lift. Set the primary metric and stopping rule before traffic starts, following these A/B testing best practices.
Each required field spends user attention. As commitment rises, a field that serves internal convenience but offers no clear user benefit may add friction before payment.
Rank candidate fixes by expected additional completed transactions. Estimate eligible users, a plausible lift, and the value of each completion, then prioritize the fix with the strongest expected return. The aim is to test a measurable cause, not the screen that drew the strongest opinions in review.
Pick One Stage to Measure This Week
Choose the stage where many users are lost and each recovered user is worth real money. That's your stage. Not the whole funnel, not a redesign program.
Define the single event that marks completion of that stage. Confirm it fires once per user, then record a baseline over at least two weeks. Can you defend that baseline when traffic mix changes next month?
Make one change drawn from the diagnosis pattern that fits your loss. Keep other major variables steady while the test runs. Compare step conversion with the baseline, segmented by device and source, before deciding whether to keep the change.
Figr can turn analytics signals into testable UX questions about why users drop, what they may not understand, which states deserve review, and what product evidence is missing. Those questions feed the next test. They don't replace your own funnel data or user research.
Open the funnel report this week. Write the stage and event on one line, then set the date when the baseline will be ready. What's stopping that line from existing by Friday?
Bring your funnel counts, analytics exports, and product context to Figr to turn drop-off signals into testable UX questions and mapped flows your team can review before building screens. Pick your leakiest stage, define its proving event, and start with the first check today.