
Behavioral analytics isn’t about counting things. It's about seeing the story behind the numbers. While traditional analytics tells you how many visitors showed up, behavioral analytics watches the clicks, scrolls, and hesitations to reveal the human narrative. It’s the art of translating user actions into a clear strategy.
From Clicks to Context
Think of your product as a city. Traditional analytics is a traffic counter on the main bridge, logging every car that crosses. It gives you a number. It's a fact. But it tells you nothing about where those cars are going, why some turn around, or where the traffic jams are forming.
Behavioral analytics is different. It’s like having a network of GPS data showing every driver's complete journey. You don't just see the volume on the bridge. You see the person trying to get to the airport who keeps taking wrong turns in a confusing part of town. One tells you how many. The other helps you understand why.
This shift moves you past the shallow "what" and into the strategic "why" of user behavior. You stop just counting pageviews and start seeing the journey.
The Shift from Counting to Interpreting
The point isn't to collect more data. The point is to find the story hidden in the data you already have. Are users repeatedly clicking on a static image, thinking it’s a button? Do they all abandon your signup form at the exact same step? Those are the clues that lead to genuine product improvements.
This is what I mean:
Traditional Analytics: "Our homepage got 10,000 visitors last month."
Behavioral Analytics: "40% of homepage visitors who start the signup process abandon it after seeing our three-step verification."
The first statement is a fact. The second is a diagnosis. A friend at a Series B company told me their "simple" checkout flow was costing them thousands a day. They only saw it when they stopped staring at total sales and started watching the user journey, step-by-painful-step. To get this level of insight, especially with forms, you need tools that see beyond the submit button. You can check out some of the best form analytics tools to get a sense of what’s possible.
Why This Matters Now
This pivot from counting to interpreting is why companies are investing heavily in this space. The global behavior analytics market is projected to rocket past USD 16.68 billion by 2030. That's a 26.5% compound annual growth rate. This isn't just hype: it's a direct response to the need for data-driven decisions to stay competitive. You can read the full research on this market trend for a deeper look.
Grasping this discipline is the first step toward building products that people actually use. And as AI gets smarter, it’s changing the game again. For a look at what's next, see our guide on product analytics tools that integrate AI for better insights. The goal is to finally stop guessing what users want and start knowing what they need.
The DNA of User Actions
To understand what your users are doing, you have to learn the language they speak with their clicks and taps. This language isn’t a conveyor belt of random actions. It’s a switchboard connecting specific intentions to outcomes. It’s a language made of three parts: events, user properties, and segments.
An event is a verb. It’s not a generic pageview, but a specific, meaningful action. Think of events as business moments: ‘Played Song,’ ‘Added Item to Cart,’ or ‘Completed Onboarding Step.’ Each one is a clue in a larger story about what your user is trying to accomplish. Tracking a ‘click’ tells you almost nothing. It’s noise. But tracking a ‘Saved Draft’ event? That tells you the user is engaged but perhaps not ready to publish.
One is data, the other is insight.
Defining the User Behind the Action
If events are verbs, user properties are the adjectives. They add the who, what, and why. These aren’t actions, but attributes that describe the person taking the action.
Common user properties might include:
Subscription Plan: Free, Pro, or Enterprise
User Role: Admin, Editor, or Viewer
Sign-up Date: A timestamp telling you if they’re new or a veteran
Company Size: A key detail for B2B products
When you combine events with properties, you go from watching clicks to telling stories. You can finally see the difference between a ‘Played Song’ event from a ‘New Free User’ and one from a ‘Longtime Pro Subscriber.’ Those are two different scenarios with different implications. To dig into the nitty-gritty of these user journeys, you can use techniques like Clickstream Analytics.
Grouping Stories into Chapters
The final piece is segmentation. This is how you organize all those individual user stories into meaningful chapters. A segment is a group of users who share certain properties or behaviors. It’s what lets you stop looking at individual trees and start seeing the forest.
For instance, a product manager at a scheduling tool might create a segment of "new users who failed to set up their availability." This isn't a random group. It's a collection of people who all hit the same critical roadblock. By isolating that segment, they might discover a confusing UI element in their onboarding is causing a huge drop-off. You can dig deeper into how to use AI tools to segment users by behavior patterns in our other guide.
This whole process is how abstract data becomes a real framework for decisions. A team I know did this for a competitive analysis of Cal.com vs. Calendly, defining events for every step in the setup flow. It allowed them to prove which tool got users to their "Aha!" moment faster, a finding you can see in their comparison of test cases.
These three elements, events, properties, and segments, are the DNA of user action. When you learn to see your product through this lens, you stop being a passive observer and become an active interpreter of human intent.
The Narrative in the Numbers
Raw data tells you what happened. A user clicked a button. Another one left the page. On their own, these are just disconnected facts, like random notes played on a piano. Your job is to arrange those notes into a coherent melody: a story that explains not just what happened, but why it matters.
This is where you stop reporting numbers and start building a narrative that drives change.
Last year, I watched a product manager stare at a dashboard showing a massive 70% drop-off between ‘User Signed Up’ and ‘First Project Created’. The numbers screamed what, but they only whispered why. By digging into the actual paths users took, the team saw it. A single, confusing onboarding step was acting like a brick wall. This is the heart of behavioral analytics: finding the friction a simple metric count will never show you.
From Funnels to Friction Points
The most common starting point for this is funnel analysis. A funnel is a series of steps you expect someone to take to reach a goal, like finishing a purchase. But just seeing the drop-off number is the beginning, not the end. The real insight comes from asking: who are the people dropping off, and what do they do instead?
Do they go back to the previous page? That might signal confusion.
Do they click a navigation link to go somewhere else? That could mean the step feels irrelevant.
Do they just close the tab? This screams frustration. Or maybe a bug.
Each of these alternate paths is a clue. A recent project involved analyzing the notoriously complex Shopify checkout setup flow. By mapping the journey merchants took, the team pinpointed the exact moments of overwhelm, leading to a redesigned flow that boosted completion rates.
This is how individual events and properties combine to form segments, which are the foundation for this kind of analysis.
As the flow shows, an isolated 'Event' is just noise. It only becomes a signal once it's enriched with 'Properties' and grouped into a 'Segment' you can analyze.
The Economic Case for Understanding Behavior
This isn't just an academic exercise. There's a powerful economic reason to get this right. The behavioral analytics market, valued at over USD 7 billion in 2026, is projected to nearly double to USD 13.4 billion by 2029. You can see the full market breakdown from MarketsandMarkets.
Why the boom? Businesses are realizing that understanding user preferences isn't a luxury. It's a core driver of loyalty and revenue.
In short, when you can connect a specific behavior, like using a feature three times in the first week, to a higher retention rate, you've found a lever for growth. You can then redesign your product experience to encourage that exact behavior.
This is the central loop of product improvement: analyze behavior, form a hypothesis, test a change, and measure what happens. This iterative process is what separates successful digital products from the rest. You can also learn more about using AI to automate product feedback analysis in our related guide. The goal is to create a living, breathing understanding of your users.
Uncovering Your Unknown Unknowns
You can shave 10% off your checkout drop-off. That’s a clear win. But the real power of behavioral analytics isn’t in optimizing the paths you already know. It’s in discovering the problems you didn’t even know you had.
Most teams spend their time on the happy path. They study the users who sign up, convert, and stick around. This is like a civil engineer only studying smooth pavement. It tells you your road works, but it teaches you nothing about why roads break.
The basic gist is this: you have to study the exceptions to understand the rule.
Learning from the Fractures
To stop bridges from collapsing, engineers obsess over stress fractures, material fatigue, and tiny deviations from the plan. They know the most important lessons are found at the edges, not in the comfortable middle. For product teams, this means deliberately looking at the weird user flows, the error states, and the edge cases.
A user who abandons their cart isn’t just a lost sale, they are a signal. Why did they leave? Did they hit an unexpected shipping cost? Did a promo code fail? Was the "next" button buried?
These aren't just minor bugs. They are the stress fractures in your product experience. Behavioral analytics is your x-ray machine, letting you find and examine them before they widen into chasms that leak revenue and trust.
Mapping the Hidden Complexity
Last quarter, a PM at a fintech company shipped a file upload feature. Engineering estimated two weeks. It took six. Why? The PM specified one screen. Engineering discovered 11 additional states during development. Each state required design decisions. Each decision required PM input. The two-week estimate assumed one screen: the six-week reality was 12 screens plus four rounds of 'what should happen when...' conversations.
By mapping out these hidden states ahead of time, a team can realize their "simple" component is actually a complex state machine with dozens of possible outcomes. This is a perfect example of what it means to truly understand what is behavioral analytics: it’s not just tracking clicks on buttons, but seeing the entire system of actions and reactions those clicks set in motion.
According to a report by the IAG Consulting group, companies lose an average of $700,000 per project due to failures in gathering and managing requirements. Proactively mapping these edge cases with behavioral insight directly attacks this problem.
This kind of early analysis, like the one captured in this task assignment component map, de-risks the entire project. It turns invisible complexity into a visible blueprint. It prevents the expensive rework that happens when you find these fractures after the code has shipped. This is the moment analytics stops being about small optimizations and starts being about preventing big disasters.
Your biggest opportunities are hidden in the journeys of those who don't make it through.
Start looking for the stress fractures.
The Human Side of the Data
It's easy for data to feel cold. A stream of events and numbers scrolls by. But behind every single data point is a person. Someone trying to get something done. Remembering this is the only way to use behavioral analytics correctly and ethically.
This diagram nails the core tension. You need data to make the experience better, but you have to earn the trust to get that data in the first place. Get it wrong, and you shatter user confidence for good. Your responsibility isn't just to the company's bottom line: it's to the people trusting you with their information.
The Line Between Helpful and Creepy
Personalization is your music app surfacing a playlist that feels like it read your mind. Manipulation is an e-commerce site using your browsing history to manufacture false urgency. What’s the difference? Intent. The technology might be identical, but the intent is what separates a good experience from a dark pattern.
Are you using insights to help people solve their problems more effectively? Or are you using them to exploit psychological triggers for your own gain? The moment your work crosses that line, you start burning the most valuable asset you have: user trust. Digging into the human-centered approach of what is qualitative analysis can provide a powerful lens here.
A friend at a fintech company told me how their team navigates this. Their rule is simple: if they wouldn't feel comfortable explaining a tracking decision to a customer face-to-face, they don't do it. That’s a powerful gut check.
Building Trust Through Security
Understanding behavior isn't just a tool for product growth. It's also one of our best lines of defense against security threats. The same pattern-matching that spots a user who is likely to convert can also spot one whose account has been compromised. This is the world of User and Entity Behavior Analytics (UEBA). It establishes a baseline of "normal" activity for every user. When behavior deviates sharply from that baseline, the system flags it.
This isn’t a niche application. It’s a field that’s exploding. In an era of constant cyber threats, the UEBA market is projected to grow from over USD 7 billion in 2026 to nearly USD 33 billion by 2034. You can explore the full research on the behavior analytics market's growth to see just how urgent this need has become.
The Harvard Business Review proposes a framework for data privacy that shifts the focus from simple compliance to building genuine trust. It centers on giving users clear value, transparency, and control in exchange for their data.
This dual focus is essential. Yes, behavioral analytics is a powerful engine for building better products. But that power comes with profound responsibility. The goal is to create experiences that aren't just effective, but also respectful and safe. In the end, data must serve the user, not the other way around.
From Insight to Action: Your First Step
Okay, the theory is done. You get it. Counting clicks is vanity, understanding why users click is sanity. The big question is, what now? Where do you actually start?
The answer is not to boil the ocean. You don't need a six-month implementation plan or a massive budget. You just need to take one small, deliberate step.
This is your first rep.
Pick One Critical Journey
Look at your product and find a single, high-stakes user journey. Don't analyze everything at once. Pick one path where a small improvement will have an outsized impact.
This could be:
New User Onboarding: The first five minutes a user spends inside your product.
Core Feature Activation: The exact sequence of actions needed to get real value.
Checkout or Purchase Flow: The path from adding an item to the cart to a completed transaction.
Just pick one. Shrink the problem until it's small enough to solve.
Define Your Key Events
Now, map out the three to five most important events in that journey. These are the moments that make or break the experience. For that new user onboarding flow, this might look like: ‘User Signed Up,’ ‘Profile Created,’ ‘First Project Started,’ and ‘Teammate Invited.’
These events become your measurement plan. They are the story beats you'll track to see where people succeed and, more importantly, where they falter.
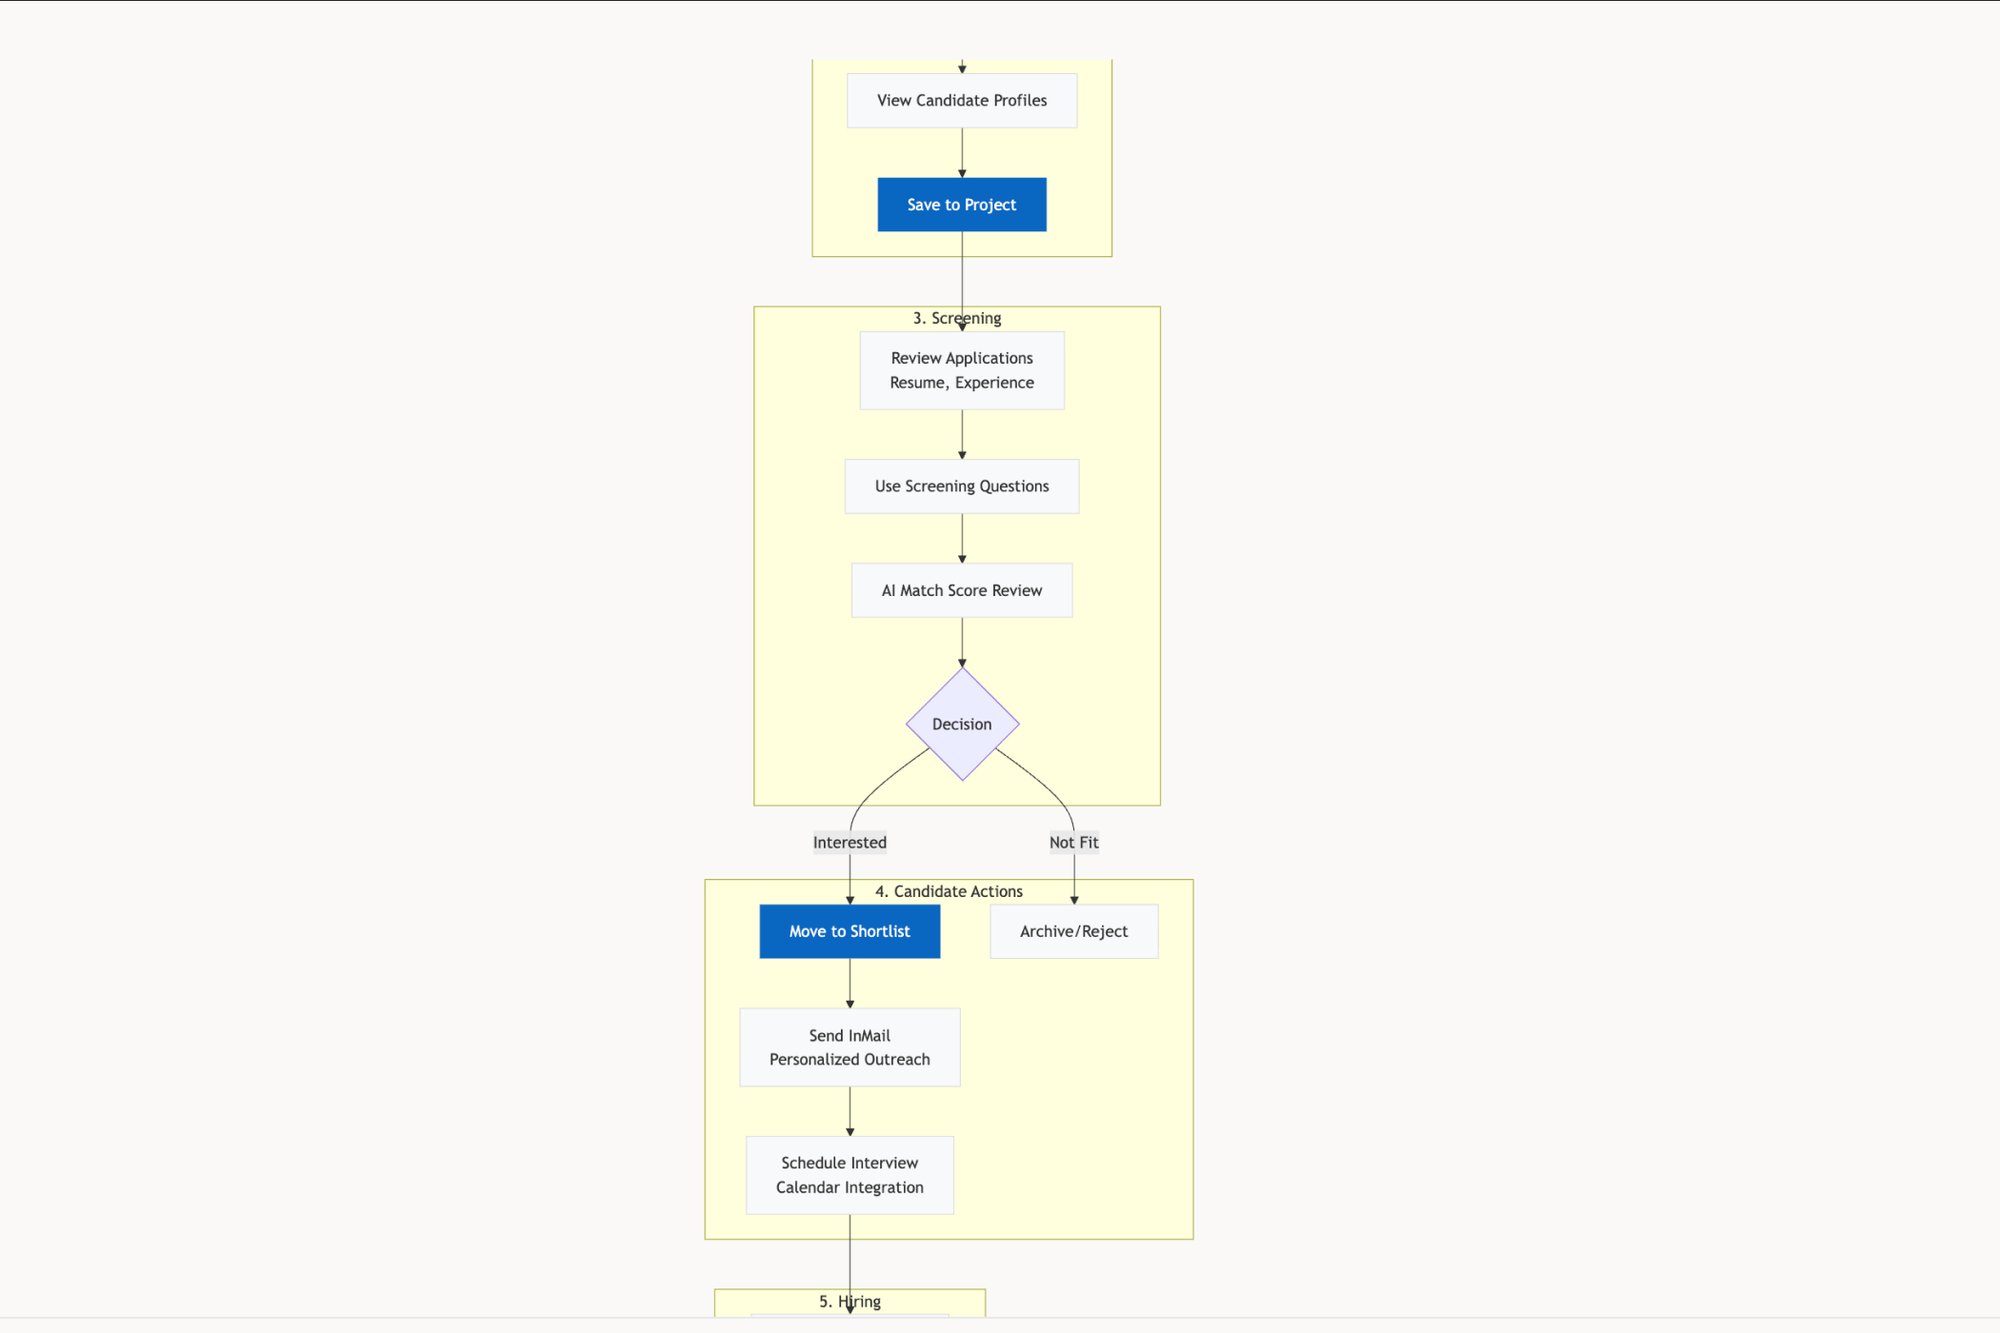
Once you have your journey and your events, you can start instrumenting that flow with an analytics tool to begin collecting data. This entire process can be done much faster than you think. For example, a tool like Figr can automatically map a complete user journey from a simple screen recording, turning a painful manual process into a quick analysis. You can see what this looks like with this LinkedIn Recruiter Flow Map.
In the end, behavioral analytics isn’t some intimidating project. It's a muscle you build. You start with a weight you can actually lift, and you focus on doing that one repetition correctly. This focused, single-journey analysis is your first rep. It’s achievable, impactful, and it’s the only way to begin.
Frequently Asked Questions
A few questions always come up when teams first dip their toes into behavioral analytics. Let's tackle them head-on.
How Is Behavioral Analytics Different from Traditional Analytics?
Let's use a movie analogy. Traditional analytics, like your standard Google Analytics reports, are the box office results. They tell you how many people bought a ticket. It’s the final score.
Behavioral analytics is the director’s commentary playing over the film. It shows you the sequence of events for each viewer. You see the exact scene where they got bored and checked their phone, and the part where they leaned in, completely hooked.
One tells you what happened in total. The other tells you the why behind each individual's story.
What Are the Biggest Implementation Hurdles?
The most common trap is trying to track every single click from day one. This just creates a sea of data noise. You'll drown in it. The real challenge isn't technical, it's strategic. What are the five actions that truly signal a user is getting value? Start there.
The second hurdle is messy event naming. I once saw a team spend weeks arguing over whether to call an action ‘File_Uploaded’ or ‘Document_Added’. This is how analysis paralysis begins. Start with a single, critical user journey, get that right, and you’ll have clean data you can actually trust.
What Should I Look for in a Behavioral Analytics Tool?
Is a tool useful if only one person on the team can use it? The best tool is the one your entire team actually uses, not just the data scientist in the corner.
Look for a clean interface where anyone can build a funnel or a retention report without needing to write SQL. A generous free tier is a huge plus. It lets you prove the tool's value on a small project before you have to ask for a budget. The real magic, however, is connecting insights to action. Some tools can map an entire user flow from a screen recording, instantly showing every possible state. We did this to analyze the card-freezing flow for Wise, and it uncovered test cases we would have otherwise missed.
That’s the difference between a simple dashboard and a tool that actively prevents rework.
Ready to stop guessing and start knowing? Figr is the AI design agent that helps you ground every product decision in real user behavior. Turn complex user flows into clear blueprints, uncover hidden edge cases, and ship with confidence. Start building better products today.