6 Availability Bias Examples Product Teams Keep Missing
Availability bias examples in product teams have a common pattern: a complaint, incident, or launch is easy to remember, so it starts to look more important or more common than the wider evidence supports. The fix is not to dismiss the story. It is to ask what population it represents, what comparable evidence says, and which alternative explanation deserves a test.
Imagine a PM reopening an onboarding redesign after one customer describes a painful setup call. The account matters, and the complaint may expose a real flaw. But if nobody checks the funnel, support history, or affected segment, the team can mistake urgency for prevalence. These six hypothetical scenarios show how that happens in roadmaps, research, QA, and UX design, and how to respond without ignoring meaningful signals.
What Is Availability Bias in Product Decisions?
Availability bias is the tendency to judge how frequent or likely something is by how easily an example comes to mind, rather than by a relevant baseline. Tversky and Kahneman described the availability heuristic as a shortcut for estimating frequency and probability. Ease of recall can be useful: common events often do come to mind readily. It becomes misleading when vividness, repeated exposure, or unusual emotion makes an event easier to recall than its frequency warrants.
The mechanism is not simply “recent things feel important.” A dramatic customer call, a screenshot replayed in several meetings, or a competitor's polished demo can all become mentally accessible for different reasons. Research on risk perception describes how dramatic causes of death can be overestimated relative to less vivid ones. In a mortality-perception study, more than 80% of participants in the reported groups judged stroke deaths less frequent than deaths from all accidents combined, despite stroke causing approximately 85% more deaths. Those findings concern judgments about mortality, not measured product behavior; the product lesson is to test whether visibility is standing in for frequency.
A newer experiment on recall and risk judgments found that recalling more examples of deaths from a hazard increased estimates of mortality and the investment participants considered appropriate to save a person. Ease can work the other way, too: in Schwarz and colleagues' recall experiment, people asked to recall twelve examples of their own assertive behavior rated themselves less assertive than people asked for six, because the longer task was harder. A memorable story and a difficult memory search are both poor substitutes for a denominator.
In availability bias in product management, that denominator might be affected users divided by eligible users. In UX research, it might mean learning which segments and tasks a finding applies to before describing it as a general pattern. The question is not “Is this story true?” It is “What decision can this story support?”
Six Availability Bias Examples at a Glance
The six examples below show distinct ways memorable evidence can crowd out the information a product decision needs. Each scenario is hypothetical; none describes a real Figr customer or claims a measured outcome.
Example: Customer complaint
Memorable trigger: A detailed account of onboarding friction
Evidence at risk of being missed: Affected segment and funnel baseline
Better first move: Connect the complaint to eligible users and task data
Example: Loud stakeholder
Memorable trigger: An executive or sales anecdote
Evidence at risk of being missed: Broader customer needs and independent reports
Better first move: Separate account importance from prevalence
Example: Production incident
Memorable trigger: A public failure and intense retrospective
Evidence at risk of being missed: Other failure paths and the new safeguard's costs
Better first move: Contain the incident, then compare risks
Example: Usability session
Memorable trigger: One participant struggles visibly
Evidence at risk of being missed: Differences across tasks and user groups
Better first move: Diagnose the problem, then check scope
Example: Competitor launch
Memorable trigger: A polished feature announcement
Evidence at risk of being missed: Evidence of demand in your own product
Better first move: Test the customer job before committing
Example: Happy-path design
Memorable trigger: A familiar successful flow
Evidence at risk of being missed: Error, permission, and recovery states
Better first move: Map states independently of the demo
These are availability heuristic examples, not a claim that every anecdote is misleading. An isolated event can be severe enough to require immediate action. The mistake is treating the event's memorability as evidence of how widely it occurs, or overlooking the costs of the proposed response.
1. A Recent Customer Complaint Becomes the Roadmap
A recent complaint creates availability bias when its detail and emotional force substitute for evidence about how many customers face the same problem. It is a useful lead, not a population estimate.
Hypothetical situation: A customer walks a PM through a frustrating onboarding step in a quarterly review. The PM starts a screen redesign that afternoon. The vivid account now occupies the planning conversation, while a less discussed step shows a larger drop-off in the team's existing funnel report.
Biased assumption: “This is our main onboarding problem.” The customer may have identified a genuine issue, but one example cannot establish that it is the largest or most widespread issue. A study of recall and judgment illustrates why additional accessible examples can change people's estimates even when the underlying hazard is held constant.
Overlooked evidence: How many users reach this step? How many fail, retry, or contact support? Does the complaint concern an enterprise permission configuration, a particular device, or everyone? What do user research methods and analytics each reveal? Interviews can clarify confusion; funnel data can locate drop-off, but a drop-off alone does not establish its cause.
Product consequence: A redesign can absorb design and engineering time while a more common barrier remains unexamined. It may also fix the wrong cause, such as changing copy when missing permissions are responsible.
Practical correction: Give the complaint an evidence envelope: record the user's task, segment, setup, severity, eligible population, similar independent reports, and funnel context. Review aggregate behavior before reading the most charged quotes in the roadmap discussion. If the account has contractual or strategic importance, document that reason separately. The team can help one important customer immediately without claiming the proposed change benefits every customer.
2. The Loudest Stakeholder Defines What Customers Need
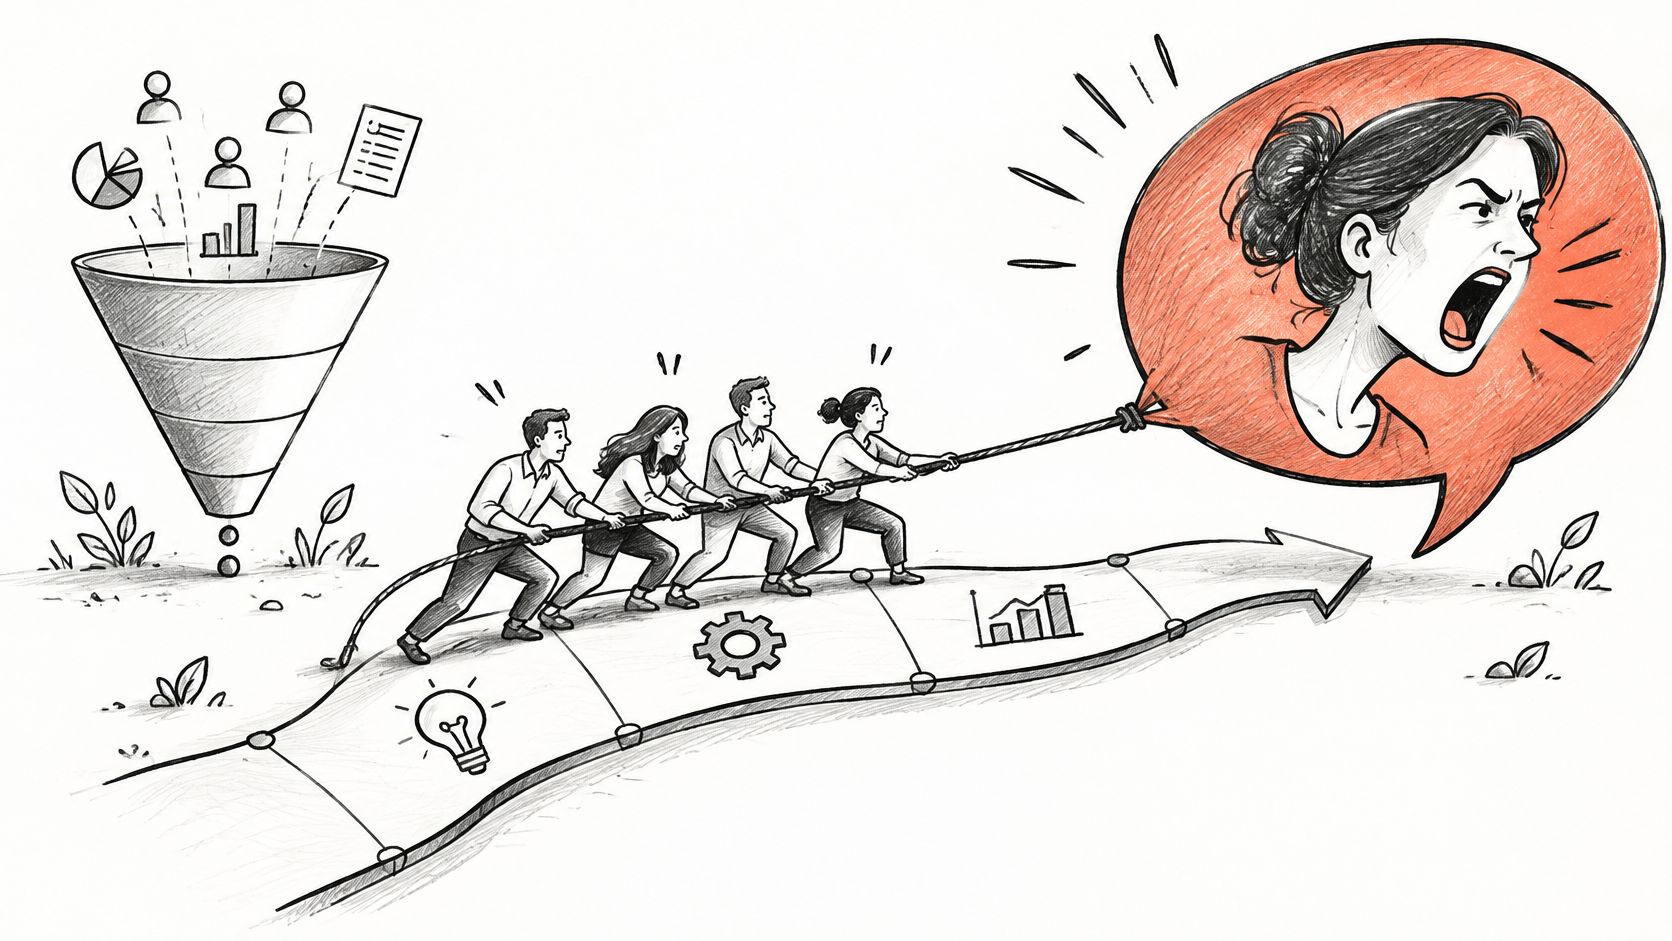
A stakeholder anecdote distorts prioritization when its prominence makes a single request feel like broad customer demand. Visibility inside the company is not a measure of user exposure.
Hypothetical situation: A sales leader shares a compelling story from a late-stage deal: the prospect wants a custom approval dashboard. The story gets repeated in a leadership meeting, a planning document, and a team chat. Three appearances make it feel like three signals, although all three trace to the same conversation.
Biased assumption: “Customers keep asking for this.” The request may be valuable, and a deal can be worth deliberate investment. But repeated retellings do not create independent evidence. The dynamic resembles the familiar shark-coverage illustration: repeated attention can make a dramatic danger easier to recall without demonstrating that its rate has changed.
Overlooked evidence: How many accounts need this approval workflow? What jobs are they trying to complete? Do existing support themes, lost-deal notes, or research show the same task independently? Does a different workflow already solve it? Segment size, revenue significance, and frequency answer different questions; none should masquerade as another.
Product consequence: The team may ship a specialized feature that complicates the product for existing users. Conversely, automatically rejecting an enterprise need because it is uncommon can miss an important commercial constraint. The goal is an honest trade-off, not a popularity contest.
Practical correction: Deduplicate the source trail. Label the original conversation, each retelling, and any independent corroboration. Compare the request against the target segment and the team's established prioritization criteria. When using AI-driven feature prioritization, require the underlying evidence and trade-offs to be reviewable rather than accepting a persuasive summary. Ask: “Would we make the same decision if the story arrived in a plain spreadsheet row?”
3. A Production Incident Defines All Future Risk
A recent production incident can make one failure mode dominate risk estimates while the risks of other paths, including the proposed fix, receive less attention. Contain the active issue first; evaluate the permanent response separately.
Hypothetical situation: Automated account setup produces a visible error. After containment, the team proposes mandatory manual approval for every account. The change would prevent a recurrence of that exact automation failure, but nobody has compared waiting times, inconsistent approvals, or abandonment under the replacement process.
Biased assumption: “The manual path is safer.” A safer-looking option needs its own risk assessment. The post-9/11 travel-choice illustration raises the same conceptual question: when people avoid a frightening option, what risk do they accept instead? That analogy does not supply product-specific rates or prove which path is safer here.
Overlooked evidence: Count setup attempts, failures, recoveries, and exposure. Inspect different customer segments and the projected operational burden. A clinical-reasoning case study describes how earlier cases shaped later diagnoses; medicine and software are different settings, but the example illustrates why a familiar failure can narrow the search for alternatives.
Product consequence: The team repairs the reported scenario while introducing delays and leaving other security or recovery gaps untouched. QA may also become a regression suite organized around the last outage rather than around the full workflow.
Practical correction: Add a regression test for the known defect, then use a test case creation guide to map the surrounding branches: interrupted sessions, expired authentication, permission changes, unavailable dependencies, and recovery. Compare the existing and proposed flows on completion, errors, waiting, support workload, and severity. Ask a reviewer who was not in the incident retrospective to name the important failure nobody has reported yet.
4. One Memorable Usability Session Speaks for Everyone
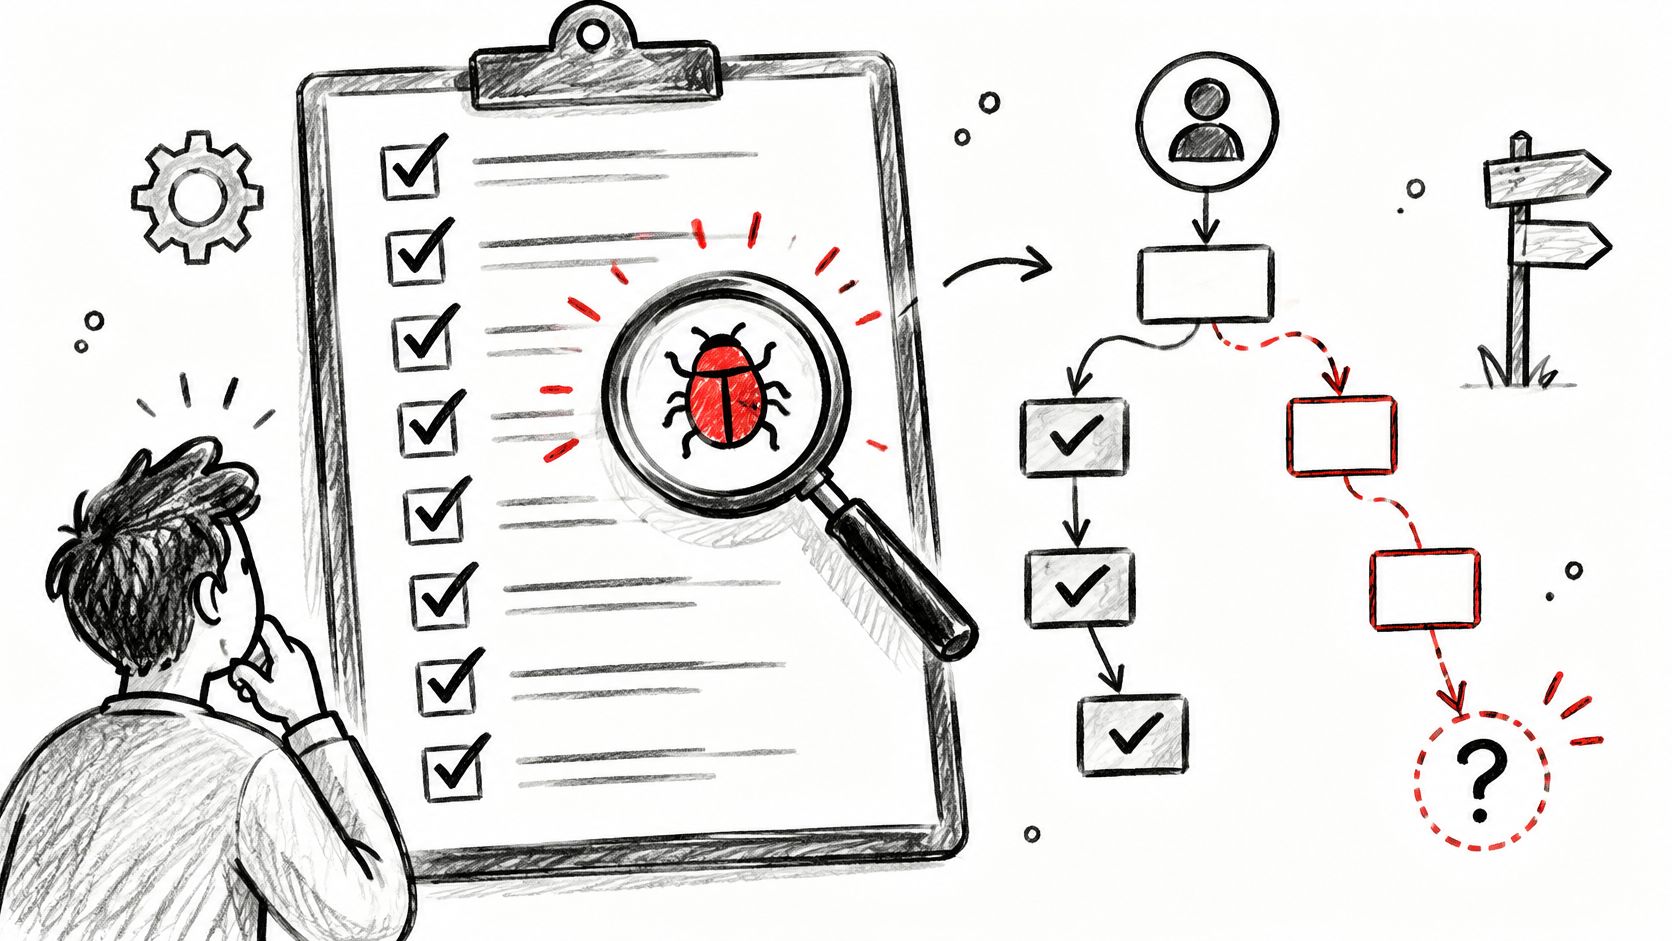
A striking usability session reveals a possible design problem, but it cannot by itself show how often that problem occurs across the target population. Diagnostic value and representativeness are different questions.
Hypothetical situation: During a study, one participant repeatedly misses a settings control and becomes visibly frustrated. The clip circulates through the design team. At review, someone says, “Users can't find settings,” although the tested task, participant's role, and other sessions have not been compared.
Biased assumption: “The session tells us what all users experience.” A single participant's difficulty may be crucial, especially if the task is essential or the failure is severe. It could also be specific to a role, prior knowledge, or an unusual setup. Nielsen Norman Group's guidance on qualitative and quantitative usability testing explains why small qualitative studies are useful for finding problems but should not be used to estimate population prevalence.
Overlooked evidence: Which participants had the same task and access? Did other users find the control, use a different route, or avoid the task entirely? What do behavioral events suggest about entry, completion, and recovery? Look for segment differences rather than averaging unlike users into one claim.
Product consequence: A broad navigation change can make a familiar workflow worse for other users, or an important accessibility and comprehension issue can be under-scoped because the team labels it an outlier. Both mistakes confuse the strength of a diagnosis with the breadth of its evidence.
Practical correction: Describe the observation precisely: “One participant with this role missed the control while attempting this task.” Review the other sessions and recruit relevant groups where needed. Use the participant's account to form competing hypotheses, then compare them with analytics or a targeted follow-up. Iterative usability testing guidance favors learning and retesting over assuming a memorable session settles the design. A difficult recall prompt can also mislead: the Schwarz experiment shows that struggling to produce examples need not mean the underlying behavior is rare.
5. A Competitor Launch Becomes a Feature Requirement
A visible competitor announcement can make a feature feel like an urgent customer need before the team has identified a job its own users need done. Memorability is not demand.
Hypothetical situation: A competitor announces an AI reporting assistant with a polished video. The launch appears in team chats and planning slides. A product leader proposes a matching assistant for the next cycle, although the team has not established whether its customers struggle to create reports or would use an assistant.
Biased assumption: “If they launched it, we need it.” This can combine availability with recency: the news is fresh, so it is easy to retrieve. It can also overlap with survivorship bias if the team studies celebrated launches while ignoring features that quietly failed. The biases should be named by the mechanism, not applied as interchangeable labels.
Overlooked evidence: What reporting task currently takes too long? Which segments perform it? What do task completion, repeat usage, support themes, and research say? In Tversky and Kahneman's letter-frequency illustration, people tended to judge words starting with r as more frequent than words with r in the third position, although the latter were more common. Ease of mental search, not fear, was the problem.
Product consequence: The team assigns substantial effort to a feature without validating its value, potentially displacing work on existing friction. A successful prototype or attractive demo can further reinforce the commitment without establishing adoption.
Practical correction: Write a job-based hypothesis: “For users doing X, this approach should improve Y.” Explore a reversible concept, compare it with simpler alternatives, and define an observable outcome using A/B testing best practices where an experiment is appropriate. Ask whether the feature would remain a priority if the announcement had received no attention. Visibility might justify investigation; it does not establish the case for building.
6. Happy-Path Familiarity Hides Error and Recovery States
Happy-path design bias becomes an availability problem when a familiar successful journey is easy to picture and less visible failure states are left out of design review. A smooth demo is one state of the product, not the entire experience.
Hypothetical situation: A team designs a checkout update around a successful payment. The prototype shows selection, confirmation, and receipt. It does not show a failed retry, an expired session, a changed permission, or the customer's return after interruption. Those states are harder to imagine because the team has not recently watched them happen.
Biased assumption: “We have covered the flow.” The product has a happy path, but completeness requires an inventory of plausible transitions and consequences. This overlaps with survivorship bias if the team inspects only completed journeys and excludes abandoned ones; availability explains why the smooth, repeatedly demonstrated path dominates what the team remembers.
Overlooked evidence: Error logs, interrupted sessions, support conversations, accessibility needs, permission models, and system dependencies can reveal states that the prototype omits. A rare irreversible transaction or data exposure may deserve attention because of severity even when its occurrence is hard to estimate. This is why the useful question is not only “How often?” but also “What happens if it fails?”
Product consequence: Recovery work gets deferred until an incident makes it vivid. Users encountering a failure then face unclear next steps, duplicate actions, or uncertain outcomes. The team can also spend later cycles redesigning states it could have identified during exploration.
Practical correction: Before reviewing the polished flow, map states from the product's structure: permissions, dependencies, timeouts, retries, empty states, partial completion, and recovery. Rank them by user impact and reversibility, then compare the map with research and observed behavior. The flood-and-protection analogy is instructive without proving a product outcome: a review of climate-risk evidence reports that personal flood and heatwave experiences can increase perceived risk without consistently producing sustained behavior change. The product equivalent is to track whether concern led to shipped safeguards and tested recovery, not merely tickets.

Availability Bias vs. Recency, Confirmation, and Survivorship Bias
Availability bias concerns ease of recall; related biases involve when information appeared, how evidence is selected, or which cases remain visible. They can reinforce one another, but separating them leads to better questions.
Bias: Availability
Main distortion: An easily recalled case seems more common or likely
Product example: One vivid complaint looks like a widespread onboarding issue
Corrective question: What is the rate among eligible users?
Bias: Recency
Main distortion: Newer information gets disproportionate weight
Product example: Last week's incident dominates risk review
Corrective question: Would an older incident receive the same weight?
Bias: Confirmation
Main distortion: Evidence supporting an existing belief receives preference
Product example: A PM collects only quotes favoring a redesign
Corrective question: What would change our mind?
Bias: Survivorship
Main distortion: Visible successful cases stand in for all cases
Product example: Teams study completed flows but not abandonment
Corrective question: Which cases disappeared from the sample?
This is a practical classification, not a diagnosis of someone's motives. A PM can seek only confirming quotes and overestimate the prevalence of a vivid complaint. A recent outage can be both new and easy to recall. Name the bias to decide what evidence is missing, not to win an argument.
How Can Teams Reduce Availability Bias in Product Decisions?
Teams reduce availability bias by placing a memorable signal beside its exposure, alternatives, severity, and a plan to check what happens next. No single dashboard or research method can do all of that work.
Use this bias-detection checklist before approving a major change:
- Identify the trigger: Is the proposal based on an incident, an interview, a stakeholder retelling, or a competitor announcement?
- Deduplicate sources: Are five mentions actually five independent events, or one screenshot shared five times?
- Name the population: Which users, tasks, plans, or situations could encounter the issue?
- Check the base rate: What proportion of that eligible population experienced the event during a relevant comparison period?
- Separate frequency from severity: Could a rare failure warrant immediate containment because its consequences are serious?
- Look for counterexamples: Which users succeed, choose another path, or report a different problem?
- Compare interventions: What new friction or failure does the proposed fix introduce?
- Log uncertainty: Which claims are observed, inferred, and still unknown?
Then use an evidence-based decision framework that works across research, QA, and prioritization:
- Record the observation without a conclusion. Write “one participant could not complete the task” rather than “the navigation is broken.” Include the original source so later retellings can be traced back.
- Choose the relevant denominator. Compare billing failures with billing attempts, not with the number of angry tickets. If reliable instrumentation is missing, say so and investigate rather than inventing a rate.
- Generate at least two explanations. The participant might have missed a label, lacked permission, or encountered a state the team did not model. Describe the evidence that would distinguish these possibilities.
- Compare options on both impact and cost. Estimate who benefits, which harms are reduced, what new friction appears, and how reversible the change is. Feature-prioritization tools can organize inputs, but they cannot make weak evidence representative.
- Test and revisit. Assign an owner and decision date. Check whether the intervention changed the intended behavior, including error and recovery outcomes. Preserve the reasoning for the next planning cycle.
A decision log makes that process repeatable rather than dependent on whoever remembers the last meeting. You can browse investment blog archives or explore policy-driven market alerts for financial context, but commentary about markets cannot establish demand for a product feature. Likewise, maintenance use cases from AI for Manufacturing can prompt questions about measurement and action without proving that the same approach will help your users.
How Figr Helps Teams Explore Evidence and Overlooked States
Figr can help teams put product context, alternative designs, and overlooked states in the same review, but it does not automatically detect or eliminate cognitive bias. People still decide which evidence is representative, how much a failure matters, and whether a design is worth shipping.
Figr is an AI product design agent for exploring and iterating on features within an existing product. Its Context Pod can retain product materials such as PRDs, research, analytics context, screens, and design references so a team does not have to reconstruct its starting point from the most recent anecdote. Its Visual Context Graph connects visual, behavioral, design-system, product-knowledge, and implementation context. Connecting sources makes them easier to examine together; it does not make a small or skewed sample representative.
For example, a team considering an onboarding redesign could provide the customer complaint, relevant research, funnel notes, existing flow, and design-system references. Figr's UX Reasoning can help explore intent, constraints, trade-offs, and possible failure paths before the team settles on a solution. Teams can map edge cases, examine multiple design directions, and review multi-state prototypes rather than evaluating only the successful screen. Design System Intelligence can help keep proposed directions aligned with established components and visual rules; Figr can also produce Figma-ready designs for further review. The Figr changelog provides updates on product capabilities, while the team remains responsible for checking the applicability of each input and validating the output.
The most useful prompt is not “Find our bias.” It is “Here is the complaint and the surrounding evidence. What assumptions are we making, what states have we omitted, and which alternatives should we compare?” That creates a reviewable product question, not an automated verdict. Bring the evidence and the current flow to Figr when you are ready to explore the design implications.
Frequently Asked Questions About Availability Bias Examples
These quick answers cover the definition, product and UX implications, and the main corrective habit.
What is availability bias?
Availability bias is judging how common or likely something is by how readily examples come to mind. A vivid case can therefore feel representative even when its frequency is unknown.
What are examples of availability bias in product management?
A roadmap led by one complaint, a feature requested through a repeatedly retold sales anecdote, and a QA plan focused only on the latest incident are examples. Each treats salient evidence as broader evidence without checking exposure or alternatives.
How does availability bias affect UX research?
A memorable participant struggle may be treated as typical of all users. The observation can identify a real usability issue, but its prevalence and segment coverage need separate investigation.
What is the difference between availability and confirmation bias?
Availability bias overweights what comes easily to mind. Confirmation bias favors evidence that supports an existing belief. Both can operate together when a team remembers only vivid examples that support its preferred design.
How can product teams reduce availability bias?
Record the original signal, deduplicate reports, check the eligible population and base rate, seek counterexamples, compare alternative solutions, and revisit the decision after observing outcomes. Keep severity separate from frequency.
The next time one story dominates a meeting, keep it in view. Then add the denominator, the strongest competing explanation, and the state the proposed solution might make worse. That is how a useful signal becomes a better product decision.