
The tool
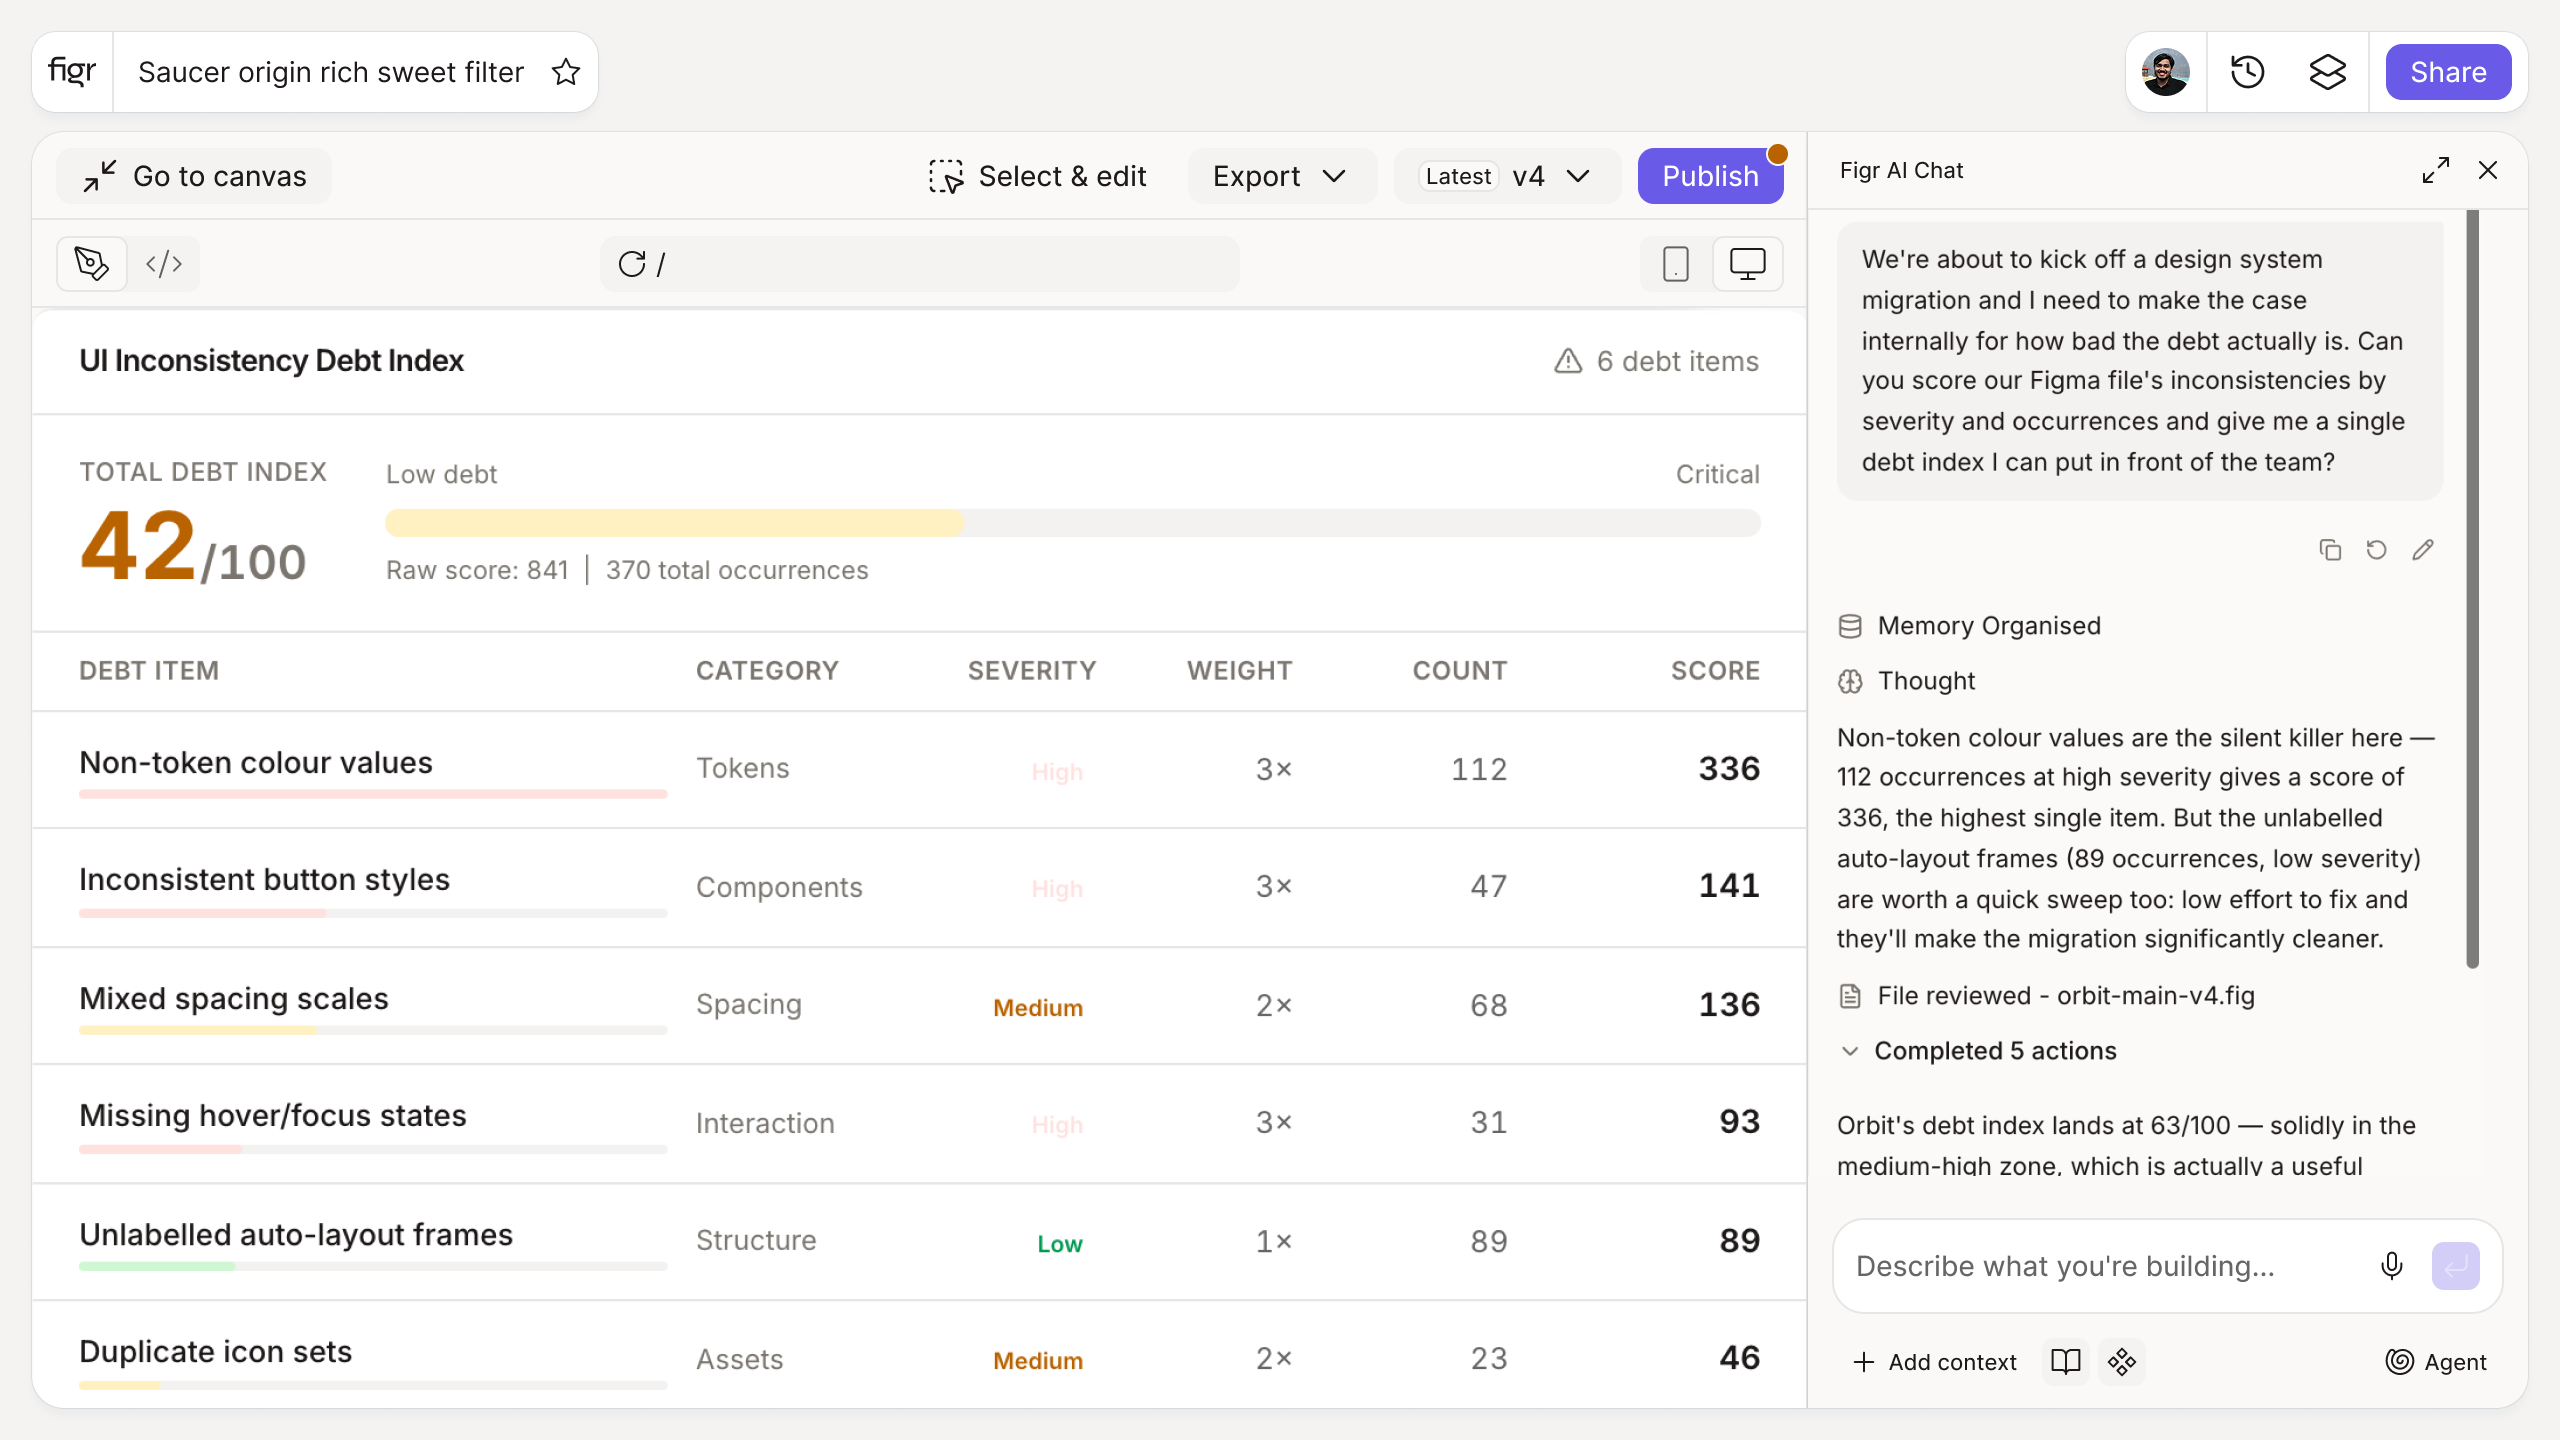
Inputs:
- Inconsistent components (number)
- Screens with hardcoded values (number)
- Token violations (number)
- Average time to fix one issue (number, minutes, optional with sensible default)
- Team hourly rate (number, optional, for a cost estimate)
Output: An estimated design debt score, total remediation time, and an optional cost estimate, with a short breakdown by category. Exportable.
Behavior: Calculates live in-browser, no login. Exportable.
How it works
1. Count the issues. Enter inconsistent components, hardcoded screens, and token violations.
2. Set the fix time. Use your own estimate or the default per-issue time.
3. Read the estimate. See total remediation time and an optional cost.
4. Prioritize the cleanup. Use the breakdown to decide where to start.
A worked example
You enter 40 inconsistent components, 25 screens with hardcoded values, and 60 token violations. At a few minutes each, the total lands around several developer-days, and the breakdown shows components are the biggest block. That last detail changes the plan: you fix the component library first because it removes the most drag per hour spent. The number is directional, not an audit, but a directional number still beats a gut feeling when you are asking for cleanup time. Much of this debt surfaces downstream as rework, which the cost of design rework breaks down.
From debt to a clean system, with Figr
This calculator sizes the problem. Figr helps you stop it from growing: it reads your design system and applies your tokens and components consistently across new work, so debt does not compound with every screen you add. Fixing the existing backlog still takes effort, but new work stops adding to it. Pair this with the design system audit to find the issues, and the developer rework cost calculator to price what the debt costs engineering.
Who this is for
This helps design leaders and system owners who need to make the cost of inconsistency legible to people who control headcount and time.
What this tool is not
It estimates the burden; it does not audit your files or fix anything. The output depends entirely on the counts and fix-time you enter, so treat it as a sizing aid, not a precise ledger. It is also a free, standalone utility, not a Figr product feature.
FAQ
Is the design debt calculator free?
Yes, free and no sign-up.
How is the estimate calculated?
It combines your issue counts with a per-issue fix time to estimate total remediation time, and optionally a cost from your hourly rate.
Is the number exact?
No. It is a directional estimate to help you size and prioritize cleanup, not an audit.
How do I reduce design debt?
Consistent token and component use on new work, plus targeted cleanup of existing screens. Figr is built to help with both.
How is this different from Figr the product?
This is a free calculator. Figr the product is an AI product designer that turns product context into UX decisions and Figma-ready design.