

Longitudinal research follows the same people, accounts, or other identifiable units across multiple points in time. For product teams, it answers a question a single dashboard snapshot cannot: did users actually change, or did the mix of users change?
Suppose onboarding completion improves after a redesign. A one-time comparison tells you that this month's rate differs from last month's. Following the same accounts can show whether people who struggled initially eventually activated, adopted a feature, or stopped returning. That distinction can change which problem you decide to fix.
This guide explains longitudinal research methods, how they differ from other UX approaches, and how to turn repeated observations into defensible product decisions. The SaaS scenarios and sample results below are hypothetical, not reported customer outcomes.
What Is Longitudinal Research?
Longitudinal research is a study design that repeatedly observes the same identifiable units over time. A unit might be a person, household, organization, customer account, or product team. Researchers establish a starting point, collect comparable observations at later intervals, and examine what changed, when, and for whom.
For a SaaS product, you might follow newly registered accounts through their first month, combining usage events with short interviews. A public-health study might follow participants for decades. The duration depends on the process: a week may reveal changes in a daily workflow, while retention or renewal may require months.
The defining features are linked units, multiple observations, and a meaningful time horizon. Collecting new survey respondents every month creates a useful trend, but it does not show how any one respondent changed. Longitudinal data can reveal sequence and persistence; it does not, by itself, prove what caused the change.
Long-running longitudinal study examples show how this distinction scales. The UK National Survey of Health and Development began with a 1946 maternity survey covering 13,687 births and followed a sample of 5,362 singleton babies. Its cohort profile in Demographic Research reports 25 collection sweeps and a latest reported survey at age 77. Product research usually uses a shorter horizon, but relies on the same principle: keep the units identifiable across observations.
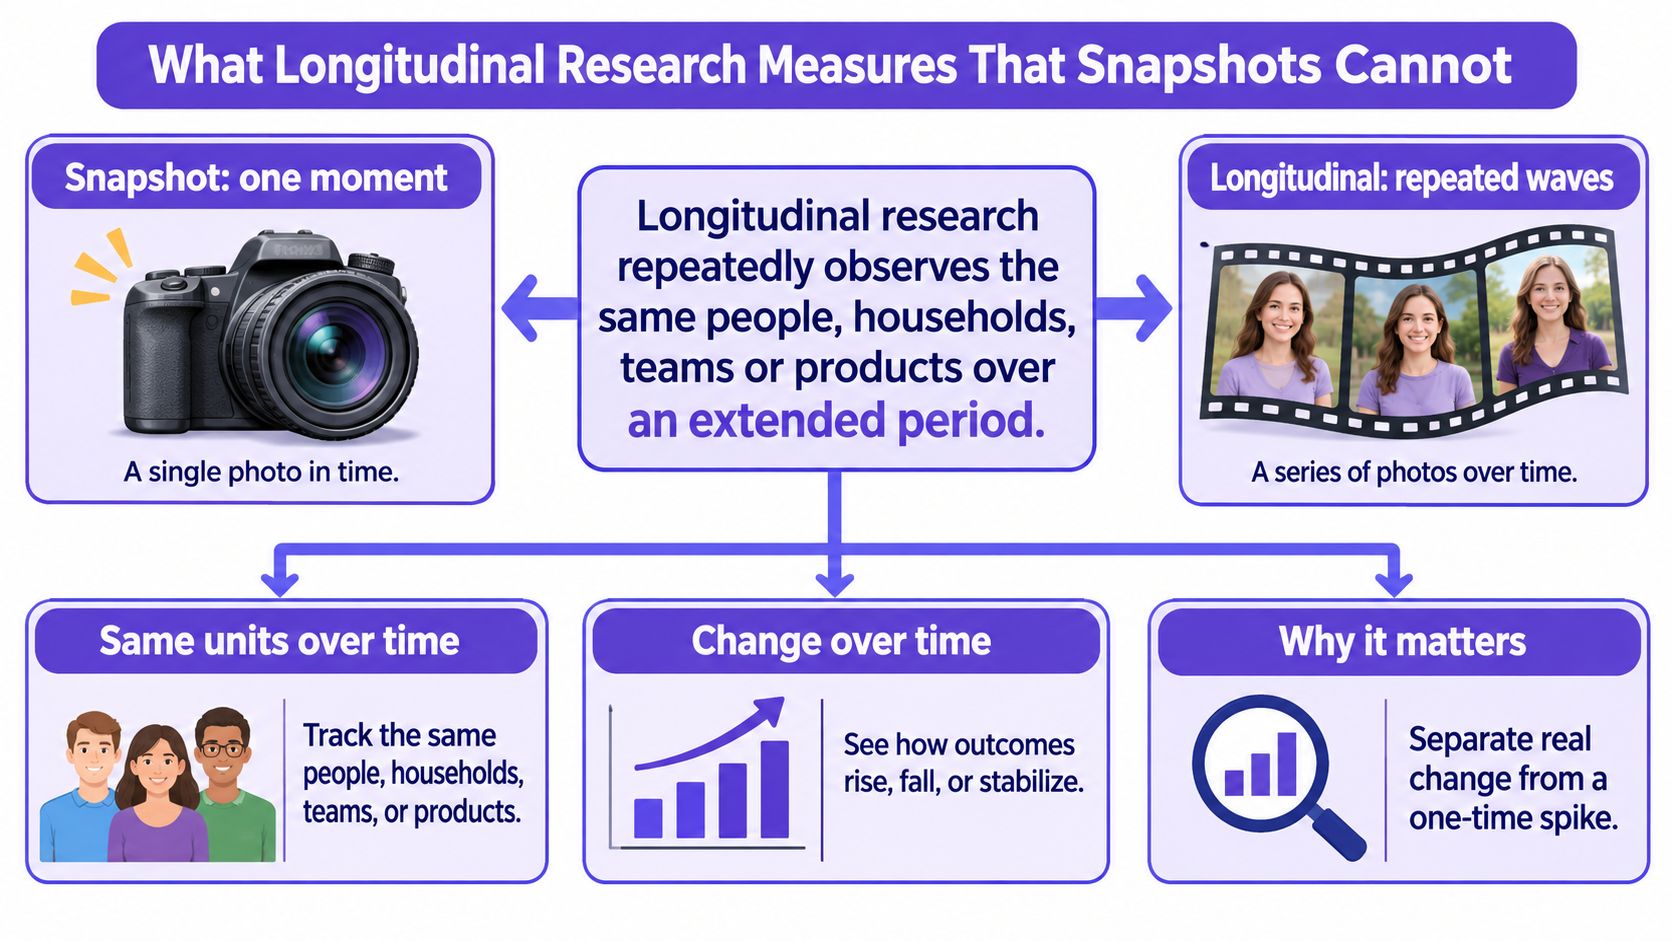
Longitudinal vs cross-sectional research
Question: Who is observed?
Longitudinal research: The same identifiable units across waves
Cross-sectional research: A population or sample at one point in time
Question: Time horizon
Longitudinal research: Multiple occasions matched to the behavior
Cross-sectional research: One observation period
Question: Best for
Longitudinal research: Within-unit change, timing, persistence
Cross-sectional research: Current prevalence, differences between groups
Question: Participant tracking
Longitudinal research: Requires stable identifiers or reliable recontact
Cross-sectional research: Usually does not require follow-up
Question: Main trade-off
Longitudinal research: More effort, attrition, measurement consistency
Cross-sectional research: Faster, but cannot directly establish individual change
A one-time usability test is usually a snapshot of performance on specific tasks. A longitudinal usability program retests identifiable participants, or repeatedly observes their real-world use, to investigate learning and changing needs. Comparing different users before and after a launch is not the same as observing change within the same users.
For a classroom analogy, Guiding Growth's resource on monitoring learning outcomes in special education helps illustrate why one learner's trajectory answers a different question from the class average. Before deciding what product teams should track, define whose trajectory matters.
Which Longitudinal Research Method Fits the Question?
Longitudinal research methods describe related but distinct ways to collect repeated evidence. Choose the unit and observation pattern first; the label follows the design.
Method: Panel study
What repeats?: Measurements from the same recruited people or accounts
Appropriate product question: How do these accounts' needs change after onboarding?
Method: Cohort study
What repeats?: Follow-up of units sharing a defined starting event
Appropriate product question: What happens to accounts that signed up in the same period?
Method: Repeated-measures study
What repeats?: The same participants complete comparable measures on multiple occasions
Appropriate product question: Does perceived task difficulty change after sustained use?
Method: Diary study
What repeats?: Participants record experiences or events throughout a period
Appropriate product question: What frustrations arise between scheduled interviews?
Method: Trend study
What repeats?: The measure repeats, but respondents may differ
Appropriate product question: Is a preference becoming more common among current users?
A prospective cohort is followed forward from a defined starting point. A retrospective cohort reconstructs earlier observations from existing records, which limits analysis to what those records captured. A birth cohort is defined by a shared birth period; a product signup cohort is defined by signup. Cohorts and panels can overlap: following the same accounts from a shared signup month creates both.
Cohort analysis in analytics often compares aggregates for signup groups, such as each cohort's week-four retention. That is useful, but an aggregate cohort curve alone cannot explain why particular users changed. Add linked account-level records and research when the question concerns individual paths.
Repeated measures refers to comparable observations on the same units. It describes a measurement structure, not necessarily a distinct recruitment strategy: a panel or cohort can contain repeated measures. A diary study is a particular longitudinal UX technique that captures in-context experiences. Nielsen Norman Group's diary-study guidance distinguishes event-triggered entries from entries requested at set intervals or prompted by signals. Diaries can reveal situations that a single interview misses, but entries depend on participant reporting and study prompts.
A familiar analogy appears in Lila's practical symptom tracking tips from Lila: repeated notes are more interpretable when circumstances and timing are recorded consistently. For an education-oriented study-method comparison, explore the ECLS study method. Neither example substitutes for deciding what your product study will measure.
When Should Product Teams Use Longitudinal UX Research?
Use longitudinal UX research when the decision depends on a trajectory rather than a momentary reaction. Useful questions include:
- Onboarding: Do users recover after an early obstacle, or does that obstacle precede abandonment?
- Adoption: Which steps happen between first exposure and routine use of a feature?
- Retention: How do needs and obstacles differ before renewal or inactivity?
- Habit formation: Does a workflow become easier with repeated use, or merely more familiar to a small surviving group?
- Evolving needs: How do customer goals change as a team grows or its responsibilities shift?
Choose an interval that matches the expected process. Daily or weekly observations may suit a rapidly changing onboarding experience; monthly interviews may be more useful for a slower workflow. The Work, Aging and Retirement article on longitudinal research discusses matching intervals to the hypothesized change process and assessing whether a measure keeps a comparable meaning across waves.
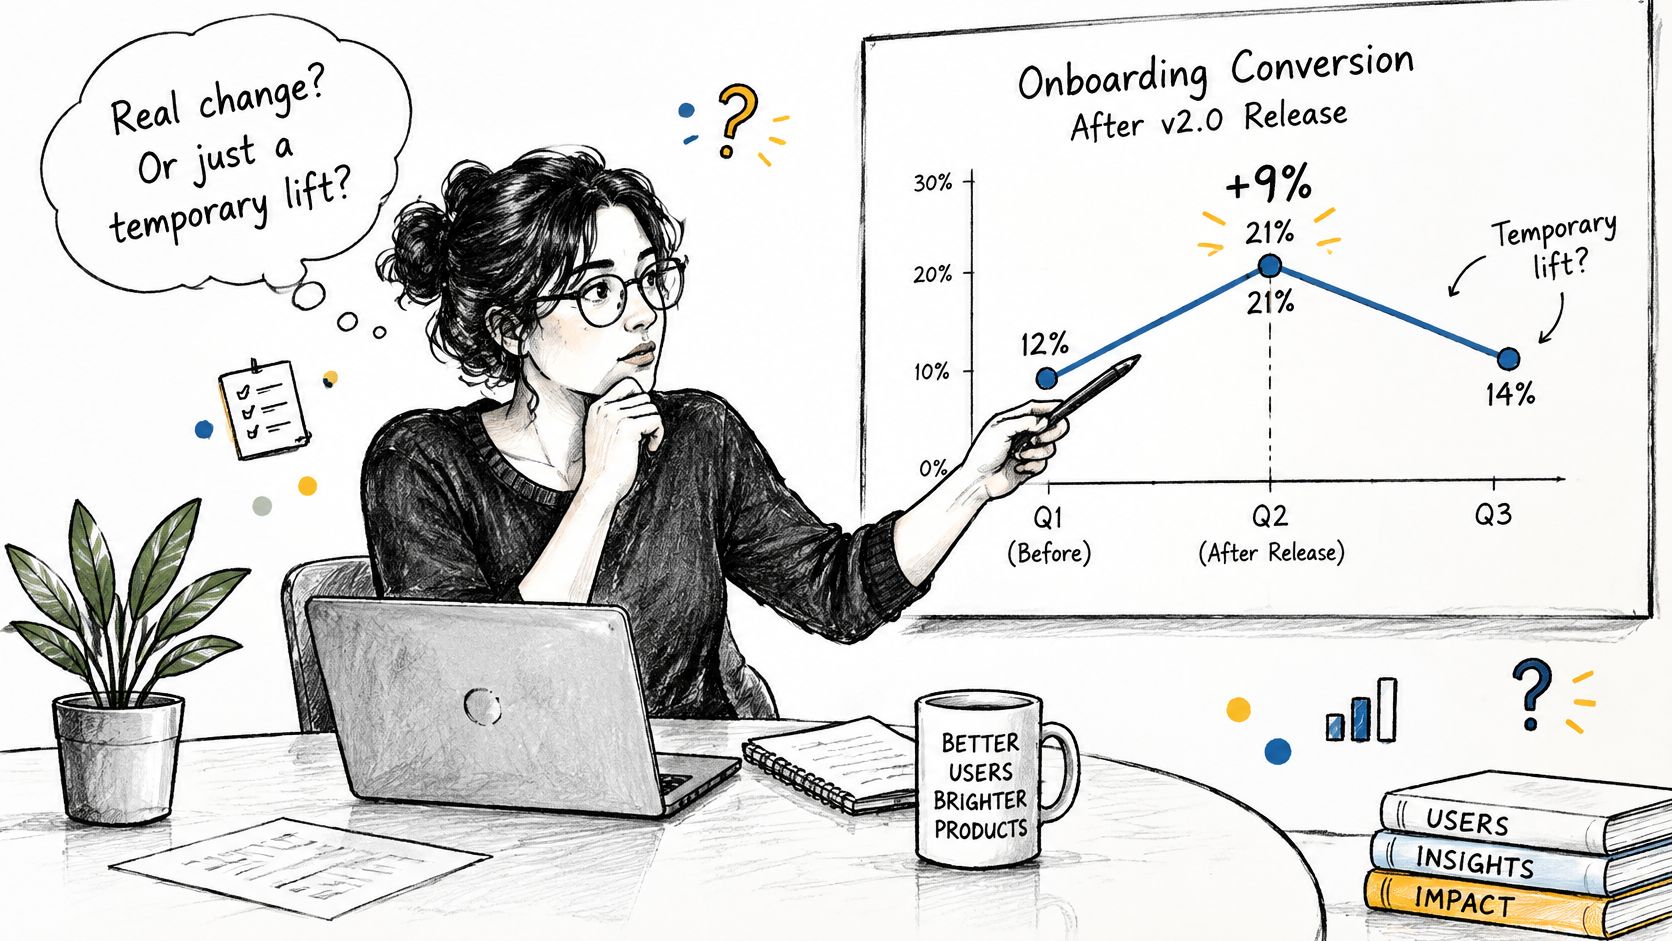
A thought experiment: an onboarding dashboard rises 9% after a hypothetical release, then falls the next quarter. Was the improvement short-lived, or did different accounts enter the sample? Following identifiable accounts gives the team a way to investigate. The 9% is illustrative, not a research result or Figr customer outcome.
A snapshot is often sufficient if you need today's preference distribution or a quick assessment of a proposed screen. Interviews can investigate possible explanations; UX research methods should be selected around the decision, not the appeal of a sophisticated study. For behavioral questions, why users act the way they do is a useful complement to the event stream. Repeated observations clarify sequence, but causal claims still need a credible comparison or experimental design.
How to Conduct a Longitudinal UX Study
Start with a claim that could be wrong. “Users get better at onboarding” is too broad; “accounts that encounter the permissions step in week one complete setup by week four” specifies a unit, an event, and a time horizon.
- Define the change question and decision. State what should change, for whom, over what period, and which product decision the answer will inform.
- Choose units and recruit for follow-up. Decide whether to follow people, accounts, or teams. Explain the duration, contact frequency, data use, and withdrawal options; avoid treating multiple users on one account as one person.
- Establish a baseline. Record initial experience, eligibility, relevant product history, and the measures you will repeat. Use an appropriately protected identifier to link waves.
- Match waves to the behavior. Schedule observations around actual use and key milestones, not an arbitrary reporting calendar. Pilot prompts to check burden and comprehension. NN/g recommends designing better diary studies around clear research questions and manageable entries.
- Collect complementary evidence. Combine repeated surveys or interviews with consented diaries, recordings, or analytics. Record release dates and changes in eligibility, instrumentation, and customer context.
- Maintain participation without hiding dropout. Set expectations, send appropriate reminders, make entries easy to submit, and document who stops responding. An exit observation can help when feasible and consented to.
- Analyze within-unit change and report uncertainty. Compare participants with their own baseline, inspect distinct paths, and check how missing observations could alter your conclusion.
Illustrative timeline, not a recommended minimum:
Moment: Week 0
Research activity: Baseline interview and event-definition check
Decision it informs: Define the initial obstacle and eligible sample
Moment: Weeks 1-2
Research activity: Event-triggered diary entries and usage checks
Decision it informs: Locate obstacles as they occur
Moment: Week 4
Research activity: Follow-up interview and linked behavior review
Decision it informs: Assess early adoption or recovery
Moment: Week 8
Research activity: Final observation and dropout audit
Decision it informs: Check whether a pattern persisted
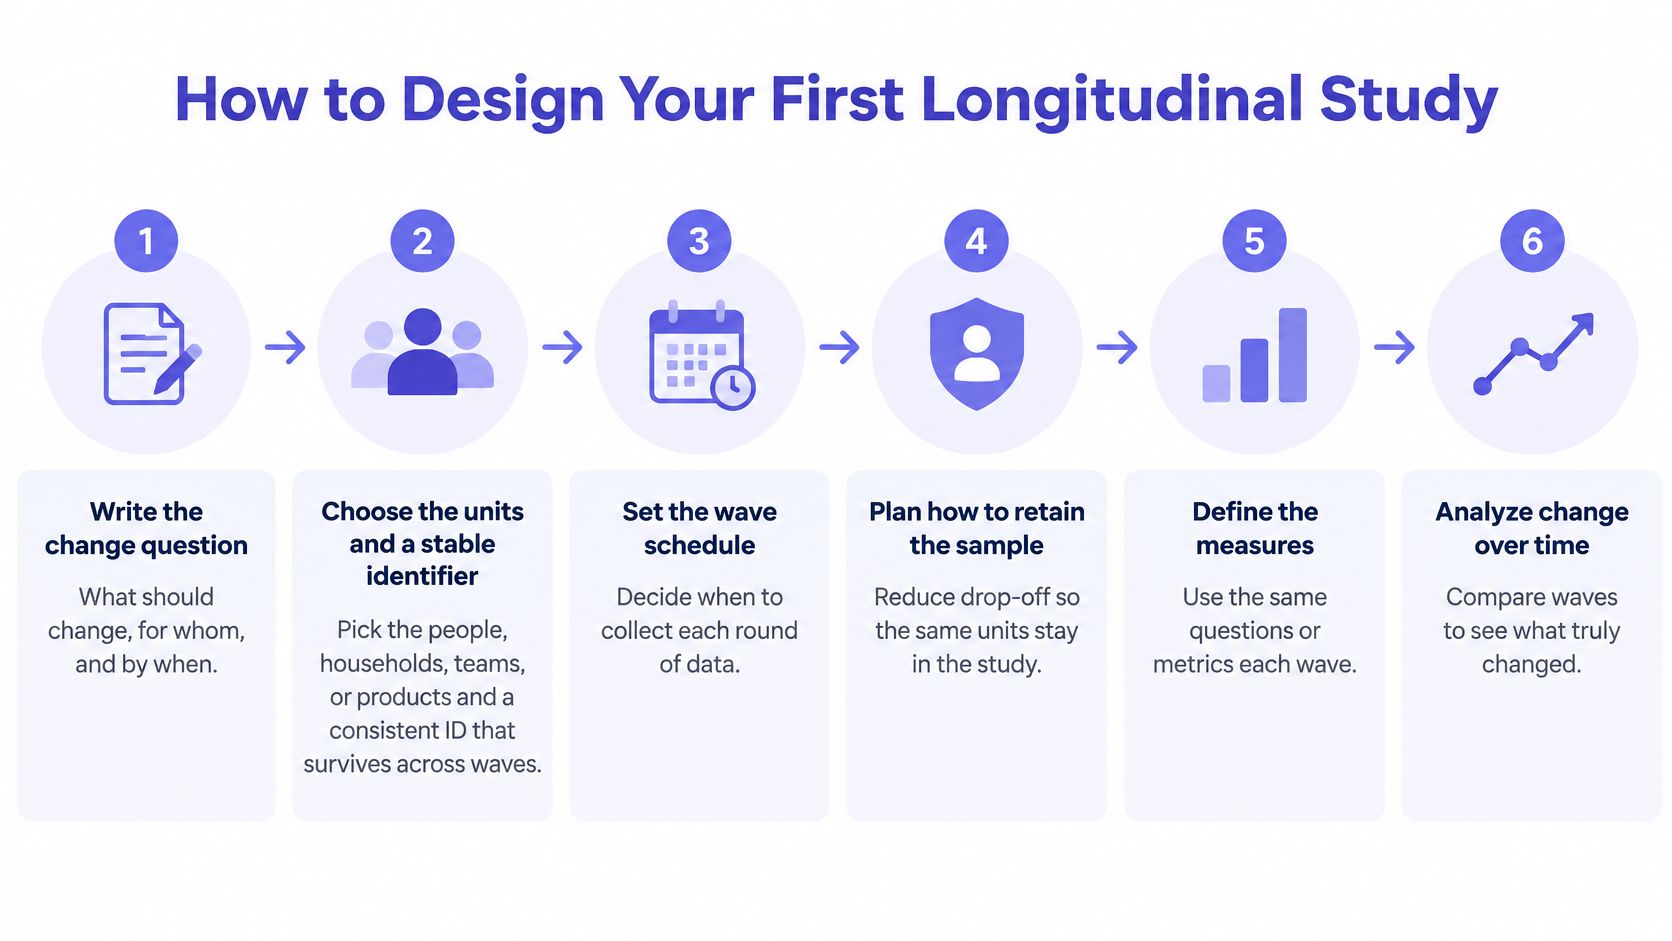
The graphic is a planning overview; the workflow above adds an explicit decision, linked baseline, and analysis audit. Before fieldwork, decide what evidence would make you reject your preferred explanation.
Three Hypothetical Longitudinal Study Examples for SaaS
These scenarios are study designs, not observed results. Each separates the question from possible evidence and a conditional decision.
1. Onboarding adoption
Question: Do new account administrators who stall at permissions eventually complete setup, or leave before inviting teammates?
Observation period: Baseline at signup, event checks after key setup steps, and follow-ups in weeks two and four.
Evidence: Linked permission events, invitations, short diary entries after failed attempts, and interviews with returning and departing administrators. Compare the same accounts' progress rather than only two monthly completion rates.
Potential decision: If several accounts report the same permissions confusion before stopping, prototype clearer guidance and an error-recovery state. Then test the change rather than assuming the diary entries establish causation.
2. Feature engagement
Question: Does a new reporting feature become part of a weekly workflow after first use?
Observation period: First exposure followed by weekly observations over an illustrative eight-week period.
Evidence: Feature-use sequences, contextual interviews, and event-based diary entries when users abandon or share a report. Compare regular users with occasional users while also checking changes within each participant.
Potential decision: If repeat use stalls at exporting, investigate export states and expectations before investing in more discovery prompts.
3. Customer retention
Question: What changes in the work of accounts approaching renewal, and do early signals precede inactivity?
Observation period: A baseline several months before renewal, monthly check-ins, and a post-renewal or exit conversation where feasible.
Evidence: Linked account activity, role changes, reported goals, support context, and missing follow-ups. Separate teams whose goals changed from teams who never adopted the core workflow.
Potential decision: Prototype different support or product flows for the distinct needs. Do not claim an interview theme predicts churn without appropriate validation.
Outside SaaS, long-running studies demonstrate different observation horizons. The NHLBI Framingham cohort description documents 5,209 original participants in 1948 and examinations approximately every two years. The Next Steps cohort profile describes 16,122 participants born in 1989-90; a UCL presentation on the ONS Longitudinal Study describes a 1% population sample with follow-up data spanning 1971-2017. Growing Up in New Zealand's check-in announcement describes more than 6,000 young people at its 15-Year Check-In. These are illustrations of sustained follow-up, not benchmarks for UX study size or duration.
How to Analyze Change Without Misreading It
Start by checking the data's structure. A single measurement supports a snapshot; a panel has many people measured on several occasions; an N = 1 time series measures one unit repeatedly; and an N > 1 time series measures several units across many time points. Longitudinal Design Choices: Relating Data to Analysis explains why the structure affects the analysis and how incomplete records matter.
First compare within-person or within-account changes. Did an administrator's task completion improve relative to their own baseline? Then look at between-person or between-cohort differences. Newly recruited accounts can lower an overall average even while established accounts improve. Conversely, low-engagement respondents can disappear and make a surviving panel appear healthier.
For qualitative material, tag diary entries and interview excerpts by participant, wave, event, and context. Trace how a theme develops within a participant rather than counting repeated comments from one person as independent votes. Pair themes with understanding user behavior with Figr only when the underlying evidence supports that interpretation.
Illustrative results, entirely hypothetical:
Account: A
Baseline: Setup started
Week 4: Setup completed
Week 8: Weekly use
Interpretation to check: What helped it progress?
Account: B
Baseline: Setup started
Week 4: No response
Week 8: No response
Interpretation to check: Did it leave, or only leave the study?
Account: C
Baseline: Setup completed
Week 4: Weekly use
Week 8: Infrequent use
Interpretation to check: Did its needs or conditions change?
Do not silently treat B as successful, unsuccessful, or unchanged. Report the denominator and retention at every wave. For quantitative analysis, repeated observations from one participant are correlated; models should represent that dependence rather than treating every row as a separate person. Fixed effects can account for stable differences between units, but not all time-varying confounders. Standard repeated-measures ANOVA may be awkward for unbalanced records, while complete-case deletion can bias estimates when missingness is systematic.
Check whether the survey item, event definition, or denominator changed. The Work, Aging and Retirement methodological discussion introduces measurement invariance: if a measure changes meaning, a changing score may not reflect changing experience. Also record releases, seasonality, and support interventions before interpreting a trajectory. Repeated exposure establishes timing, not causal attribution; use A/B testing best practices or another credible comparison when an intervention's effect is the question.
Common Mistakes, Limits, and Ethics
- Selective attrition: People who leave the study may differ from those who remain. Show participation by wave and compare departures with continuing participants using available baseline information.
- Recall bias: An end-of-month interview may miss a fleeting frustration. Event-based diary prompts can capture it closer to the event, although diaries remain self-reports. NN/g discusses both the value and burden of diary studies in context.
- Practice effects: Repeatedly completing the same task can improve performance even if the product does not change. Record prior exposure and consider alternative tasks or comparison designs.
- Changing conditions: A release, pricing change, campaign, or season can affect behavior between waves. Keep an audit trail of external and product changes.
- Instrument drift: A rewritten survey question or changed analytics event can create artificial movement. Preserve definitions and annotate unavoidable changes.
- Privacy and consent: Linked recordings, diaries, and account events can expose sensitive behavior. Collect only what the question needs, explain access and retention, and apply appropriate controls.
- Correlation mistaken for causation: A feature launch preceding improved adoption is not proof the launch caused it.
A comparison of cross-sectional and longitudinal studies from Editor World provides additional background, while this clinical overview of longitudinal studies discusses follow-up demands. The longitudinal study overview is a useful orientation, but use study-specific methodological sources to justify analysis choices. For an example outside product research, an English long-COVID cohort study demonstrates how the population and follow-up window must be stated before interpreting a reported outcome.
A beautiful trajectory with an undocumented denominator is difficult to defend.
Tools and a Reusable Longitudinal Study-Plan Template
No single tool supplies the whole study. Use a diary form or prompt system for in-context entries, surveys for comparable measures, interviews for explanation, analytics for linked behavior, and a controlled research repository for protocols and findings. Confirm that identifiers can be joined appropriately, and separate access to identifiable data from broader findings.
Copy this study-plan checklist:
- Decision: What will the team change, and what competing explanation would reverse that decision?
- Units and eligibility: Who or what is followed? How are units linked across waves?
- Baseline: Which behaviors, perceptions, and context are captured before change?
- Measures: Which questions and event definitions stay stable? Who approves changes?
- Schedule: Which events trigger entries, and when are planned follow-ups?
- Participant experience: What is the time burden, reminder plan, consent process, and withdrawal route?
- Data management: Where do diaries, recordings, interviews, and analytics live? Who has access?
- Attrition plan: How will missed waves, withdrawals, and subgroup retention be reported?
- Analysis: Which within-unit comparisons, cohort differences, themes, and confounders will be examined?
- Decision rule: What evidence prompts a prototype, a test, or further research?
Before scaling, pilot the linking and collection process. If the same units cannot be identified reliably or a measure changes meaning between waves, repair the protocol first.
How Figr Turns Longitudinal Insights Into Product Designs
Figr is an AI product design agent, not a participant-recruitment service or longitudinal-study platform. It helps teams explore and iterate on features within existing products and design systems after researchers and product teams have collected and interpreted evidence.
Figr's product-aware designing documentation describes a Visual Context Graph connecting visual screens, behavioral flows, design-system context, product knowledge, and implementation context. Its Context Pod can retain relevant inputs such as research, PRDs, analytics, recordings, and product screens for design work; the official changelog documents the evolving workflow. UX Reasoning helps examine intent, constraints, alternative paths, and edge cases. Design System Intelligence helps align explored states and components with the supplied system, while user flows, multi-state prototypes, and Figma-ready output support review and handoff.
Return to the hypothetical onboarding scenario. A team could bring its consented diary synthesis, event definitions, relevant recordings, PRD, existing screens, and Figma context into Figr. It could explore a clearer permissions step, a recovery path for failed invitations, and the states users encounter after returning. A multi-state prototype makes those alternatives reviewable before the team tests them with users. The team, not Figr, decides what the study establishes and whether a proposed change improves outcomes.
If the question is still “why did users leave?”, analytics context alone cannot answer it. Use research and product judgment to frame competing hypotheses, then test the promising designs against the next relevant wave of evidence.
Frequently Asked Questions
1. What is longitudinal research?
It repeatedly observes the same identifiable people, accounts, or other units over time to examine change, timing, and persistence.
2. What is an example of longitudinal research?
A SaaS team might follow the same new accounts from signup through later check-ins, combining setup events and interviews to examine how onboarding progresses.
3. What is the difference between longitudinal and cross-sectional research?
Longitudinal research follows the same units across multiple occasions. Cross-sectional research observes a sample at one point in time and cannot directly show how an individual changed.
4. Are diary studies a type of longitudinal research?
Yes. Diary studies collect repeated in-context entries over time, often alongside interviews or usage data. Not every longitudinal study uses a diary.
5. How long should a longitudinal UX study last?
Long enough to observe the behavior relevant to the decision. Match follow-ups to the expected change process rather than assuming one duration fits onboarding, habits, and renewal.
Next step: Choose one metric that currently hides individual trajectories. Define the unit, baseline, follow-up interval, and decision it will inform before collecting another wave.
Bring your research synthesis, funnel notes, analytics exports, and existing product context to Figr to explore testable UX improvements grounded in what you learned.