
The billing review is stuck on step count. Design wants three screens instead of five. Engineering says tax, payment, and inventory each need a confirmation, and the product manager chairing the meeting can't say whether users are lost or the approvals are required. Nobody in the room has written down what a customer believes will happen at the moment they press Continue.
That gap gets expensive in predictable ways. Controls ship with labels that make sense to the team and not to the buyer. Support tickets arrive describing behavior the system never had. A segment abandons a task at the one step where the interface hides a rule, and a feature gets funded for a need that one loud interview implied and no behavior supports. Each outcome traces back to an unwritten explanation of how the task works.
This guide treats the mental model diagram as the artifact that closes that gap. It separates what users believe, what the product is designed to do, and what the interface says, then shows how to hold each one against evidence. By the end you should be able to take one disputed workflow and decide whether to change the steps, change the labels, or leave the flow alone.
When a Review Cannot Name the Mismatch
A diagram of this kind records a working explanation, not a wish list. The user's account of cause and effect is the object under study, and the product's support for that account is the second half of the picture.
The billing example earns its place because it fails in the ordinary way. The team can describe five screens and two confirmations. It cannot say which expectation each confirmation violates. A short round of user research methods aimed squarely at that question, rather than at general satisfaction, produces the raw material for the anatomy below.
What a Mental Model Diagram Contains
A mental model diagram externalizes a user's working explanation of a task so a team can compare it with intended behavior and visible interface cues. The object being mapped is a person's causal story, not a ranked list of features.
Cognitive-science accounts treat a mental model as an internal simulation of a real, remembered, hypothetical, or imaginary situation, used to anticipate what happens next and weigh options (modeltheory.org's definition). For a product team, that means the map should carry expected causes, predicted outcomes, and next actions. Strip those out and you're left with a preference survey wearing a diagram's clothes.
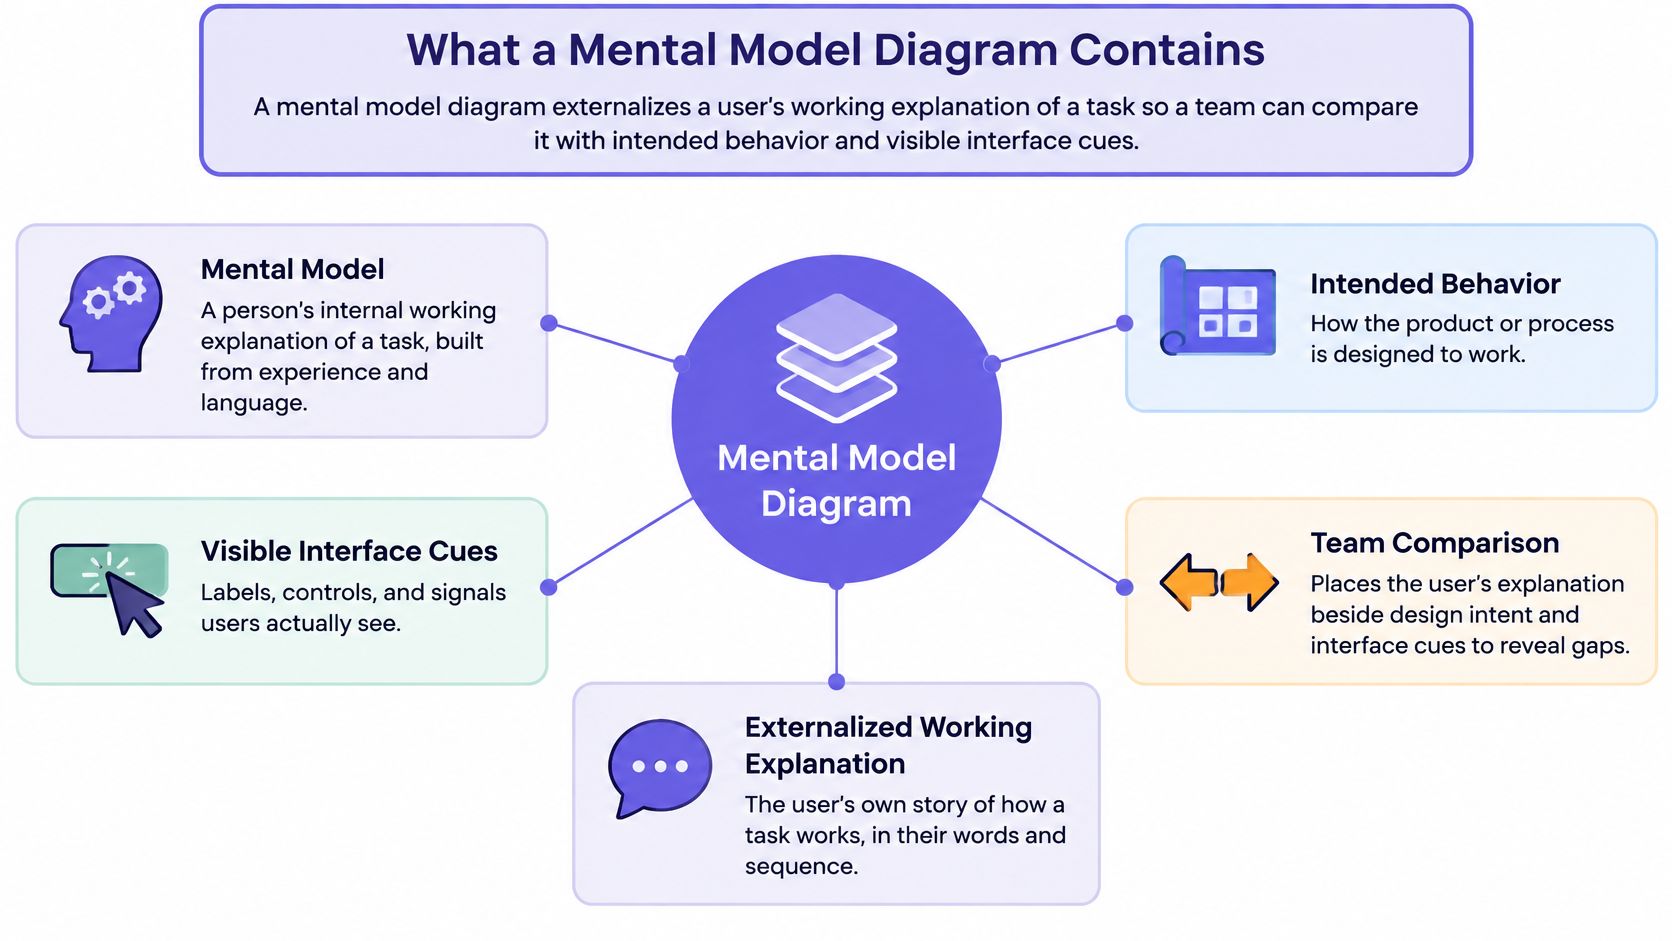
Nielsen Norman Group's guidance on mental models in UX keeps three representations apart, and a diagram that matters keeps them apart on the page too.
| Layer | What it holds | Mismatch signal | First response |
|---|---|---|---|
| User mental model | Beliefs, expected causes, and next actions | User predicts the wrong result | Conform to the shared model or teach a new one |
| Designer conceptual model | Intended rules, constraints, and workflow | Team assumes users already know the rules | Rewrite the rules in user language |
| System image | Labels, controls, feedback, and help | The interface hides the rule | Add signifiers, status, and recovery |
Practical rule: If a box on the map can't be stated as "the user expects X to happen next," it belongs in a backlog, not in the model.
Towers Above the Line, Support Below It
Indi Young's two-part structure does the layout work. Interview-derived tasks, beliefs, and feelings stack into vertical towers above a dividing line, related towers group into broader mental spaces, and the organization's features, content, and services sit below the needs they're meant to serve, as this experience-mapping reference describes. The method builds bottom-up, often with laddering that moves from a specific act toward the broader goal behind it.
An unsupported tower is a candidate gap. It's not yet a feature, and that distinction carries the rest of this article.
The intellectual history explains why the format works. Kenneth Craik's 1943 book The Nature of Explanation proposed that people construct "small-scale models" of reality and use them to simulate alternatives before acting, as a review of mental model theory recounts. A diagram is that simulation made external, with relationships turned into symbols a team can inspect and revise. Donald Norman's 1983 discussion split the system, the designer's conceptual model, and the user's mental model, and his 1988 book The Design of Everyday Things popularized the designer model, system image, user model framing, as a human-computer interaction summary explains.
In short, the user layer holds belief, the designer layer holds rules, and the system image holds everything the interface communicates about those rules. Draw one line through each and the argument becomes specific.
Then walk a single chain for each task: goal, expected action, predicted response, observed response, resulting interpretation. Mark where predicted and observed part company. The key decision that follows is whether the product should conform to a widely shared model or deliberately teach a new one through clearer feedback and explanation.
Mental Model Diagrams Next to Other Maps
A mental model diagram lines up what someone believes will happen with the features, content, policies, and services that exist. Neighboring artifacts answer different questions, and picking the wrong one burns a review cycle without settling anything.
| Artifact | What it holds | Use it when | It will not show |
|---|---|---|---|
| Mental model diagram | Beliefs, towers, and product support | The team disagrees about a predicted outcome | A screen-by-screen build sequence |
| Journey map | Stages and touchpoints over time | The experience sequence is the open question | The belief that caused a wrong click |
| Empathy map | Says, thinks, does, and feels | A workshop needs one persona's perspective | Tasks lined up against features |
| User flow | Screen paths and decision branches | The rule is already agreed | Why the user expected another result |
| Service blueprint | Frontstage actions and backstage handoffs | Ownership and operations are the issue | The user's causal story |
The billing review from earlier fails a simple test: two audiences, finance admins and everyday managers, hold different expectations about the same screen. That's two belief models, not two stages of one journey. A journey map would sequence the experience beautifully and still leave the mismatch unnamed.
If the team cannot name the mismatched prediction, start here. If the belief is already agreed, draw the flow or the blueprint next, then go to the method that can hear the user's words and watch the task fail.
The ordering matters because each artifact assumes the previous question is settled. A user flow drawn before the belief is agreed documents the team's assumption and calls it a design. A service blueprint drawn before the causal story is known maps handoffs between teams that may be solving the wrong problem efficiently.
Which Method Reveals Which Belief
One source is a starting point, never a complete diagram by default. Each research method exposes a different part of a user's model, so the choice of method decides what the map can claim.
| Method | What it reveals | Best moment | Limit |
|---|---|---|---|
| Contextual interview | Vocabulary and real-world workflow | Before any tower is named | Small samples miss rare segments |
| Card sorting | How people group and name content | Before information architecture | Grouping is not task success |
| Tree testing | Whether a hierarchy matches expectations | After a draft navigation structure | No emotion or recovery detail |
| Think-aloud usability test | Predictions, surprises, and recovery | On a prototype or live task | One task does not map the whole model |
Different methods surface different parts of the model, which is why a comparison of mental model research techniques argues against building a diagram from a single evidence type. Contextual interviews give you the language people use and the workflow they run. Card sorting shows how they group and name content before navigation is locked. Tree testing checks a proposed hierarchy against those expectations. Think-aloud testing catches the moment a prediction breaks and the recovery attempt that follows.
The Order That Keeps the Diagram Honest
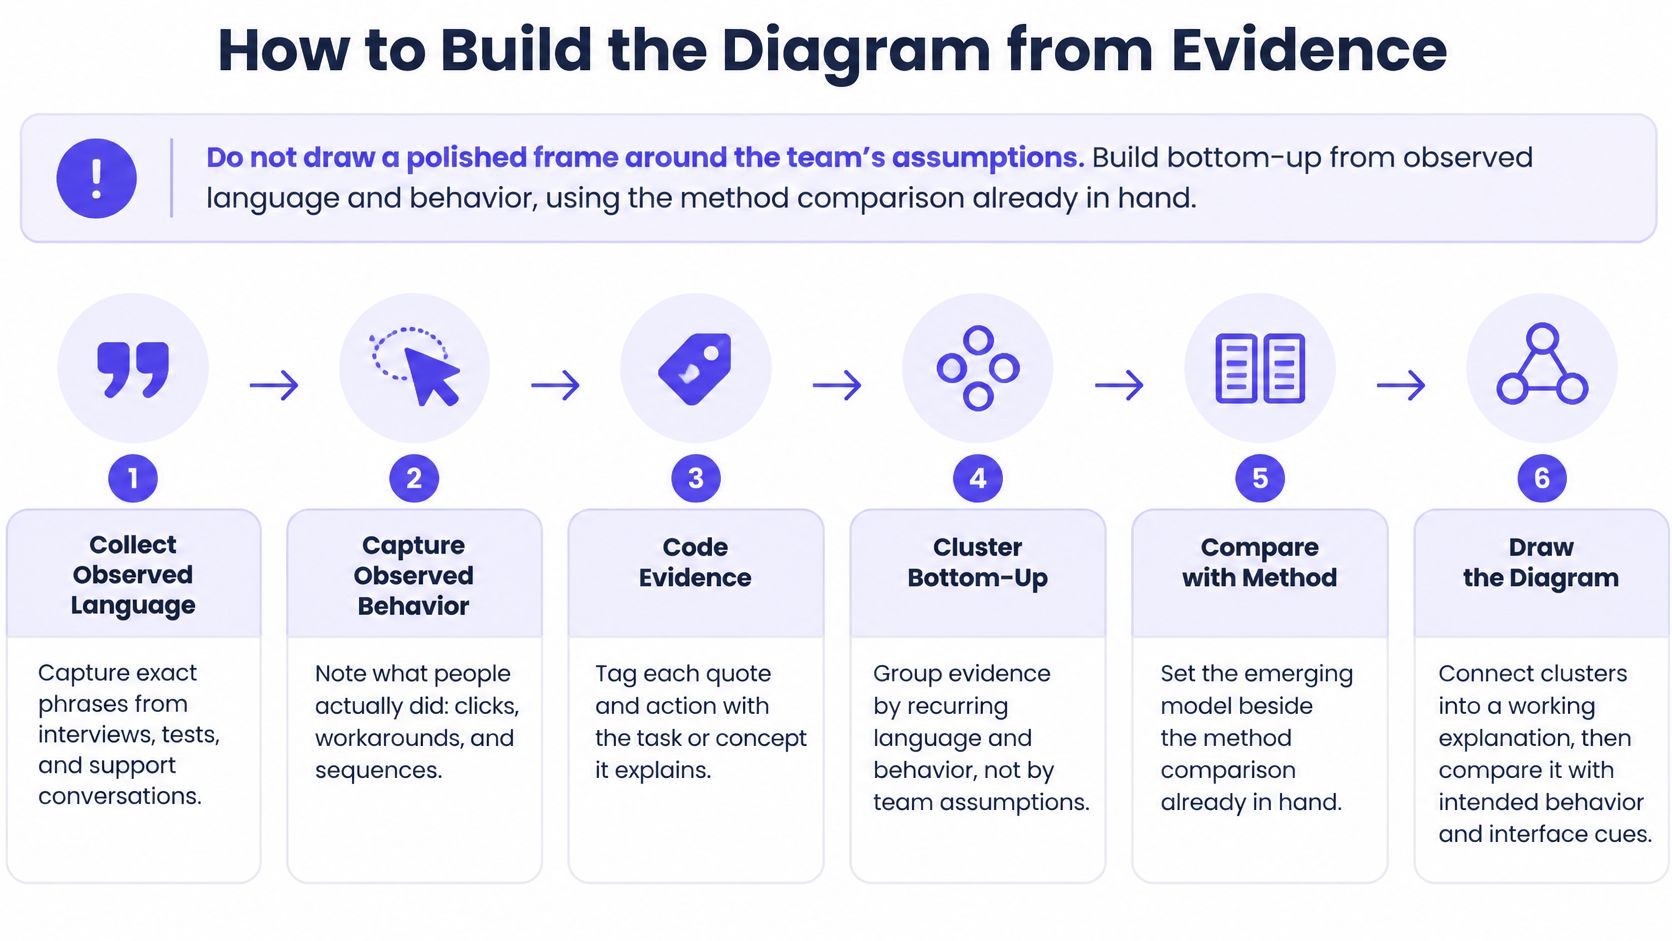
Collect observed behavior and language first. Cluster recurring tasks and beliefs second. Place existing features underneath the resulting themes third. Reverse that order and you draw a polished framework around the team's assumptions instead of mapping what users believe and do.
Boundary matters here. A diagram serves strategy and roadmap alignment across tasks; a single usability test serves one task. Asking a test to carry a strategy decision produces a conclusion the sample can't support.
Skipping straight to a survey of preferences is the most common shortcut and the least useful one. You get feature votes rather than causes and expected outcomes, and the resulting chart is a ranked wish list. The pull toward product teams is real: in its 2025 State of UX report, Userlytics found 62% of organizations said UX primarily serves product teams, which raises the stakes on evidence that can survive a roadmap conversation.
Choose the smallest pair of methods that can both hear the user's words and watch the task fail.
For teams working through naming and grouping, card sorting methods for product teams cover the practical mechanics of the second row in that table. Whichever pair you choose, the diagram should be the synthesis step, not the first draft.
How to Build the Diagram from Evidence
Do not draw a polished frame around the team's assumptions. Build bottom-up from observed language and behavior, using the method comparison you already have in hand.
- Step 1. Pick one decision.
Name what the team must settle, such as whether checkout needs three confirmations. Name the users whose belief decides it. - Step 2. Collect behavior and vocabulary first.
Run contextual interviews before anyone draws a box. Record exact phrases, sequences, and workarounds. - Step 3. Add a second method only where the decision needs it.
Choose from the method table rather than applying every technique. A tree test earns its place when labels are the dispute. - Step 4. Extract tasks, beliefs, feelings, and the user's own words.
Keep contradictions visible instead of averaging them into one voice. Two accounts that disagree are a finding. - Step 5. Cluster into towers, then into mental spaces.
Group recurring items by language and behavior. Use laddering to move from a specific act toward the broader goal behind it. - Step 6. Place existing support underneath.
Features, content, policies, and services go below the towers they support. Leave the space empty where nothing supports the need. - Step 7. Mark unsupported towers with the break.
Write the predicted versus observed divergence on each one. "User expects Continue to save a draft" is a usable annotation. - Step 8. Attach source, segment, and confidence.
Every tower carries who said it, which segment, and how sure the team is. A later reader should be able to audit any box on the page.
That sequence prevents a specific failure: the workshop poster that looks complete because nobody had to cite a participant. Clustering without provenance produces confident shapes and no argument behind them. For the mechanics of the grouping step itself, how UX teams cluster research data covers sorting rules that keep quotes attached to their source.
Where AI Helps and Where It Breaks the Chain
Clustering is the obvious place to apply automation, and demand is visible in the tooling market. In a March 2024 survey of 48 experts working with diagramming and graph solutions, Synergy Codes reported that 87% of CEOs rated a diagram prompt builder the most valuable AI feature.
Speed is not the same as evidence. An AI cluster that arrives without quotes, segment labels, and a human review status is a frequency artifact until someone checks it. Keep step 8 intact when step 5 gets faster, and treat the tool as a first pass a researcher confirms.
Which gap deserves funding is a separate question, and it comes next.
How to Score a Gap Before Building
A tall tower with weak product support is not automatically a feature. It may be a naming problem, an education problem, a policy issue, or a task users should never have to perform in the first place. Treating every empty space as an opportunity is how roadmaps fill with work that improves a diagram and not a product.
The contrarian rule: the diagram's job is to describe a divergence, and the roadmap's job is to decide whether the divergence is worth closing. Those are two different meetings.
| Signal | Question to answer | Hold the feature if |
|---|---|---|
| Frequency | How often the task or belief appears | Only one interview mentions it |
| Severity | What breaks when the prediction is wrong | The harm is mild and a workaround exists |
| Behavior | What task success, drop-off, or support shows | No behavioral trace supports the quote |
| Segment | Who holds this model | It appears only in one narrow expert role |
| Cheaper fix | Could content, policy, or structure close it | A new feature is the first proposal |
The basic gist is this: mental models reveal what people think and expect, while analytics reveal what they do. Neither source alone establishes business impact, and a quote without a behavioral trace is a hypothesis with good typography. Existing guidance on mental model diagram methods builds maps from qualitative interviews and compares intentions with features, then recommends prioritization in broad terms such as tower height or visible misalignment. That's where a product leader needs a sharper threshold.
The Threshold That Earns a Roadmap Slot
A gap should appear in more than one independent source, affect a defined segment, and show a measurable behavior before it takes capacity. Frequency, severity, behavior, segment, and a cheaper-fix check together form that bar.
Below the bar, annotate the gap as a hypothesis and write down the missing signal. "Two managers mentioned it, no support contacts, no funnel trace" is a complete sentence and a legitimate outcome of the exercise.
If you need a starting frame for weighing those gaps against user value, customer needs analysis for PMs covers how to rank needs without collapsing them into feature requests.
As products and teams grow, an unscored diagram becomes a coordination cost. Every stakeholder can point at a different empty box, and the loudest voice in the review sets the priority. A shared threshold settles that argument faster than a planning meeting, and it scales when the number of towers outgrows the people who built them.
A Billing Diagram That Changes the Call
Say a product manager is reviewing an upgrade flow for a SaaS billing product used by two groups: finance admins who reconcile invoices and everyday managers who just want a receipt. The scenario is hypothetical, and so are the counts.
Inputs: eight contextual interviews, one tree test of the settings labels, one think-aloud session on the live upgrade. Two towers emerge from the clustering.
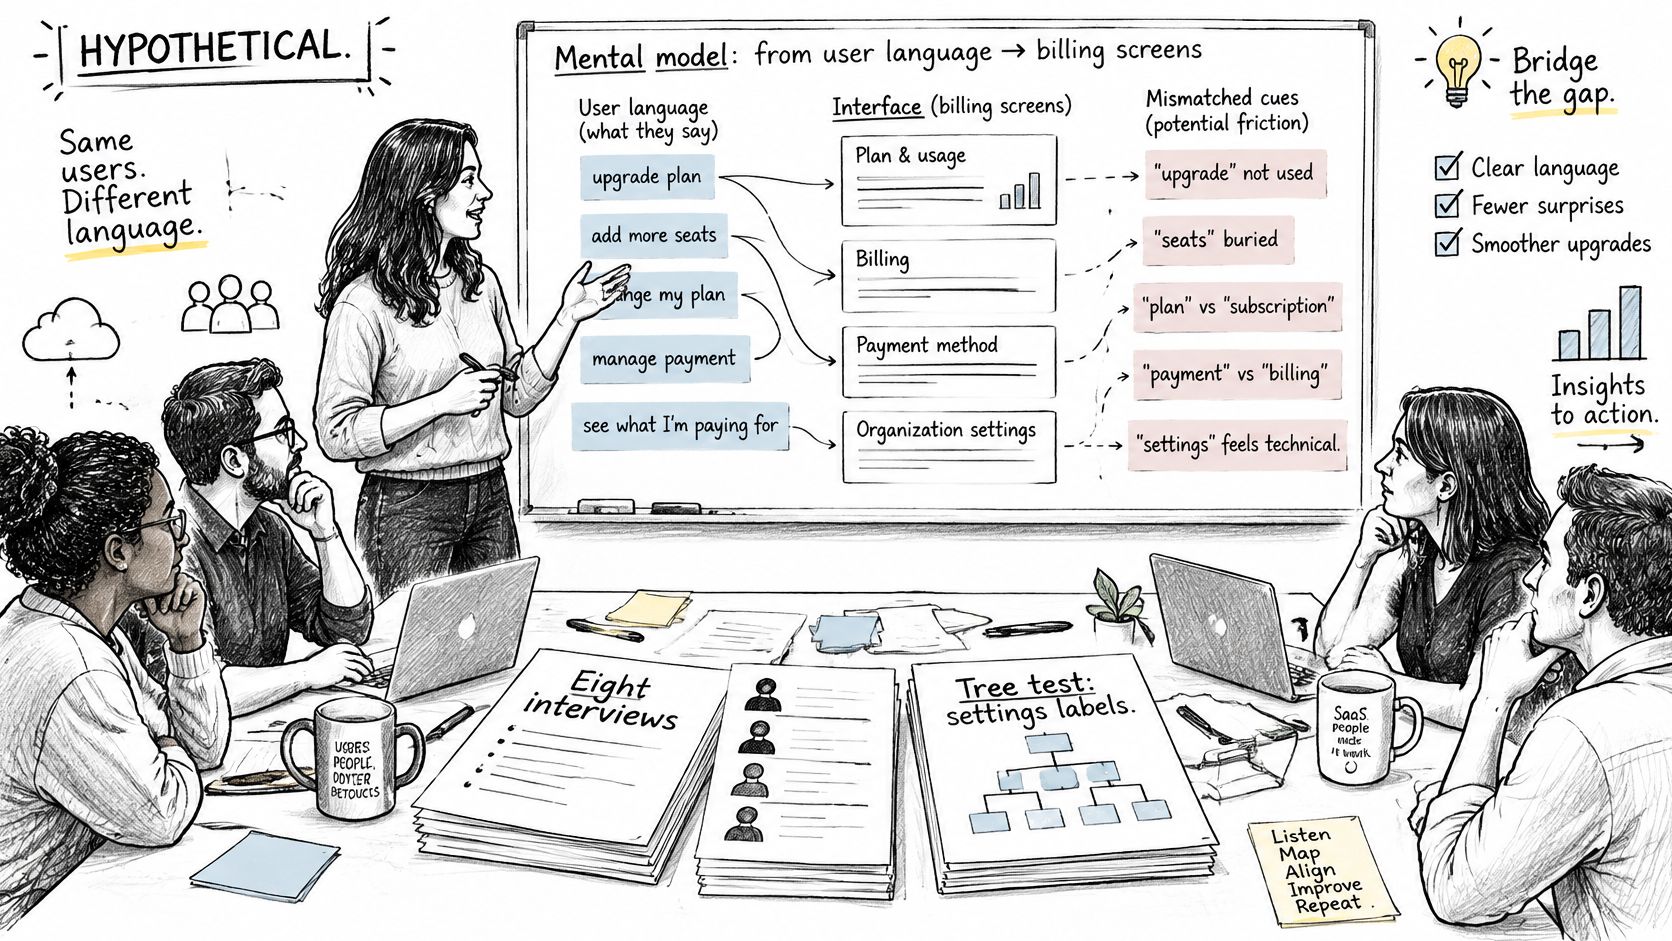
The first tower is finance admins expecting a preview of tax and proration before they commit. It has quotes from five admins, several support contacts about surprise invoices, and a visible drop-off on the review step. The second tower is managers expecting one price and a receipt. It has two mentions and no behavioral trace.
The tempting wrong call is to fund a shorter three-step wizard, since the map looks crowded and the confirmations feel like friction. The better read is a divergence: admins predict that Continue means save a draft, while the system charges immediately. The problem lives in the system image, not in the number of steps.
The Three Changes That Follow
- Rename the action. Label the button for the outcome it produces, so the predicted response and the actual one match.
- Show proration before commit. Put tax and proration on the review step, where the expectation already forms.
- Add an empty state that explains approval. Tell users who can approve a change and what happens after they submit.
Products that put charges in the open before a commitment are worth comparing against, and Tutorbase's billing feature set is one reference point for how that pattern reads on a screen. The manager request stays in the diagram as a watched hypothesis, annotated with its two sources and its missing signal.
Nobody deletes the confirmations. The team changes what the interface says, and keeps the required workflow intact. Stated in observable terms, the team can now name which belief changed the interface and which gap did not earn a feature.
The boundary is worth writing down too. If a later test shows managers failing the same prediction at the same step, that tower reopens with evidence behind it.
Where a Clean Diagram Misleads
Simplification is the value and the risk in the same move. A mental model diagram helps because it drops detail, and that same cut can hide context, emotion, social pressure, or a constraint that changes whether someone clicks.
Cognitive-science research describes mental models as simplified knowledge structures that shape perception, problem solving, judgment, learning, and decision making, and increasingly draws them as cause-and-effect networks, as this research review sets out. Read that as a warning label. The map is a working model for one segment in one time period.
- Merging segments that predict differently. Finance admins and first-time managers don't share a model, and one diagram can't hold both without labels.
- Letting an AI summary stand alone. A cluster with no source quote is unauditable, however clean it looks.
- Freezing last quarter's towers. A pricing change or a policy update can invalidate a map that nobody rechecked.
- Funding an unchecked link. A mapped relationship that never met a behavioral signal is a guess with a box around it.
AI adoption raises the stakes rather than settling them. Askable's 2025 UX research trends report notes that 58% of surveyed teams use AI research tools, with 21% applying AI in most or all studies. That's coverage of a trend, not proof a cluster is correct.
Annotate every AI-assisted tower with four things: confidence, segment, source quote or observation, and human review status. When interviews and tests disagree, keep both models on the page and test the relationship that would change the decision. Then take the one-week action below.
Map One Decision Before the Next Review
Pick one disputed task before the next design review. Sketch the three layers on a single page. Score the widest gap on frequency, severity, behavior, segment, and a cheaper-fix check, and bring the source note rather than a screenshot of a poster.
Done looks like a team that can point to a belief, the system response it expects, and a decision: change the flow, change the label, or change nothing because the belief was right. Keeping that reasoning visible is the point of Figr, which maps the current flow, lists missing states, and drafts the user flow before anyone treats a screen as final.
Is a mental model diagram worth it for a small feature
Only when the team disagrees about what users think will happen. For a single label change with an agreed belief, a usability test costs less and answers faster than a full map with towers and mental spaces.
How many interviews are enough to trust a tower
Treat fewer than two independent sources as a hypothesis rather than a finding. Beyond that, no universal sample size applies, because a rare but severe failure can matter more than a frequent minor one, and inventing a threshold invites false confidence.
Who should update the diagram
The person who owns the decision keeps the map current. Research supplies quotes and segment labels, design owns the system image and the labels on the screen, and neither should edit a tower without adding a source note.
What should you do when analytics and interviews conflict
Keep the tower, add the behavioral trace, and design the test that would settle the prediction. A funnel drop at the exact step where users expect a draft to save is a sharper finding than either source alone.
If you have a disputed workflow sitting in a review queue right now, Figr can map the current flow, surface the states a screen is missing, and explain the tradeoffs before your team commits to a design, so the argument about what users believe happens on one shared page instead of in three competing slide decks.