

Your loudest customer asked for the feature, so you built it, and then almost nobody used it. A PM told me last week that her team shipped a bulk export in six weeks, demoed it to cheers, and watched weekly use flatline by the next planning cycle.
That failure pattern costs more than engineering time. The roadmap fills with requests from vocal accounts, quieter segments keep their spreadsheet workarounds, and support tickets still arrive because the underlying job was never solved in the first place.
Customer needs analysis solves that by treating every request as a hypothesis about a job, then checking it against behavior before you commit. You'll classify needs, quantify tradeoffs, and carry a traceable chain from a customer's words to a decision your team can defend.
What Customer Needs Analysis Really Asks
A finance lead asks for an export button on your reporting page. What does she need? Probably numbers in front of her CFO by Friday, in a format she trusts, without rebuilding the same view every week. The button is a proposed answer. The Friday deadline is the need.
The working definition: customer needs analysis identifies customer needs, organizes them by importance, and links them to product decisions. The definition is simple. The hard part is separating the outcome people want from the feature they name when they try to be helpful. A request is a hypothesis. A need is the job behind it.
That distinction matters because stated requests and observed behavior often diverge. If the finance lead exports once a quarter, the Friday deadline may be a one-off. If support tickets show weekly copy-paste workarounds, the need is recurring. Needs analysis puts both signals on the table before the roadmap commits.
Where the Discipline Came From
The method has formal roots outside software. As Shopify's Voice of the Customer guide traces it, Quality Function Deployment was created at Mitsubishi's Kobe shipyards in 1972 and was later adopted by Toyota to translate customer requirements into engineering priorities, while in 1993, Abbie Griffin and John Hauser defined Voice of the Customer as a process for identifying, organizing, and prioritizing customer needs.
That history frames needs analysis as a decision discipline, not a one-time survey before a redesign. Shipyards and SaaS teams face the same economics: vague requirements get expensive once you build the wrong thing at scale. The method forces a written chain from customer evidence to design choice, so a team can defend why it built one thing and deferred another.
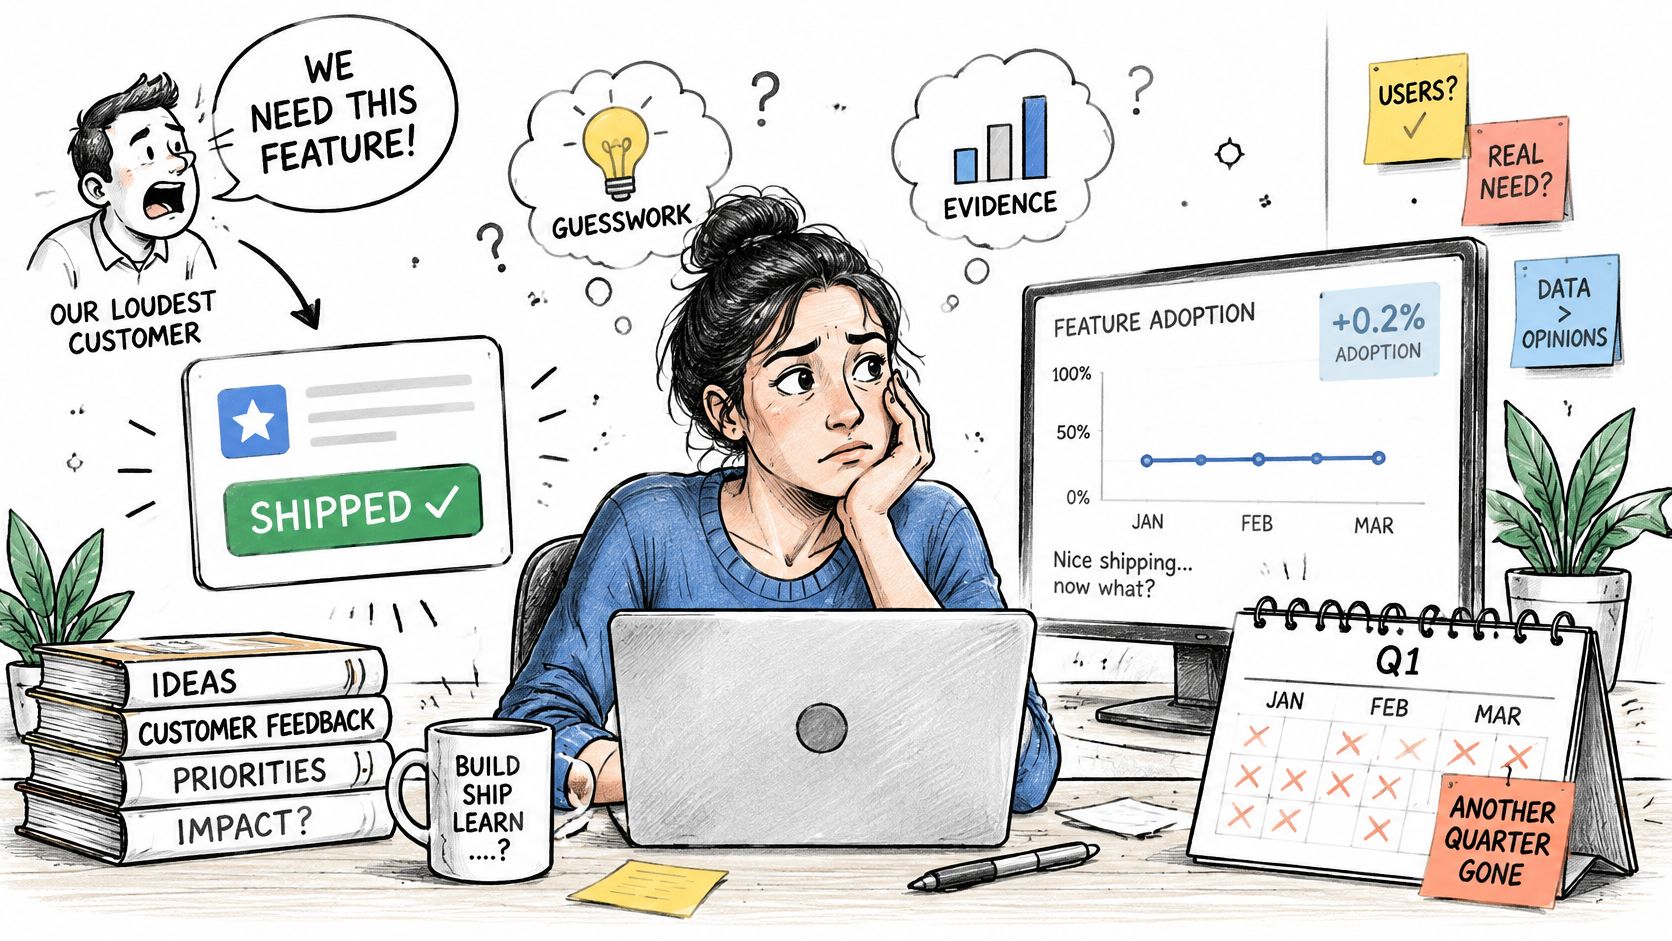
Skip that structure and the damage is predictable. An enterprise account with a named champion outvotes hundreds of mid-market users who never file tickets. A feature ships, adoption stays flat, and the team debates marketing when the problem sits in discovery. The loudest request wins because no one separated volume from importance.
Segment definition sharpens the work before you recruit anyone. If your customer definition is fuzzy, take time to refine your ideal customer profile so you know whose Friday deadline you're designing for. A tight segment also tells you which behavior to sample: the finance lead's export habit, the mid-market user's spreadsheet workaround, or the champion's edge-case request.
A request tells you what someone imagined. A need tells you what progress they're trying to make.
Matching Each Method to the Question You Have
A team runs a survey because surveys feel efficient, gets back a tidy ranking of features, and still cannot explain why anyone wants them. The method was chosen by habit rather than by the question, and the output looks like evidence.
Four questions recur in needs work: why someone would switch, how widespread a need is, whether it is a baseline or a differentiator, and what people do in practice. Each has a method that answers it and a method that produces plausible noise.
| Method | Question it answers best | Evidence it produces | Main watch-out |
|---|---|---|---|
| Jobs-to-be-done interviews | Why would someone hire this product for this job? | Struggling moments, desired outcomes, verbatim need statements | Stated reasons drift after the fact |
| Structured surveys | How widespread is a need across segments? | Ranked needs at scale, with segment cuts | Rankings reward familiar features and hide trade-offs |
| Kano questionnaire | Is this need a baseline or a differentiator? | Category per need: must-be, one-dimensional, attractive | Works only on a clearly defined feature list |
| Conjoint analysis | How much will customers trade one attribute for another? | Utility estimates per attribute level | Needs careful experimental design and enough respondents |
| Behavioral analytics | Where do users stall, and how often? | Funnel drop-offs, repeat workarounds, abandonment | Shows what happened, not why it happened |
| Netnography | What do people say about the product unprompted? | Rich need statements tied to current usage | Groupthink risk in online communities |
| Focus groups | How do people react to a concept together? | Discussion themes and reactions | Emphasizes past usage and group consensus |
Two rows show the logic. If users stall at first export, analytics locates the stall but cannot say whether they feared wrong numbers or never found the button. An interview can. If six candidate needs exist and the question is which affect the most accounts, interviews will not scale and a survey will.
Why No Single Channel Sees Everything
Channel choice changes what you find. A 2024 study comparing netnography with focus groups identified 23 distinct need types across five dimensions. Online-community analysis captured 21 of the 23 needs, or 91%; focus groups captured 22, or 96%.
That near-tie hides a difference in kind. The same study found netnography produced clearer need statements tied to current usage, while focus groups leaned toward past usage, and both were vulnerable to groupthink. Each channel's blind spot sits somewhere else, which is the practical argument for pairing them.
Unprompted conversations in communities, reviews and support threads supply the language customers use when nobody is watching. Moderated sessions supply the follow-up question that turns a complaint into a job. Sequence the work accordingly: qualitative first to surface candidate needs, quantification only for the candidates that survive, then analytics to check whether behavior agrees. A need that no behavior corroborates is still a hypothesis.
Grounding those pairings in user research techniques keeps the choice deliberate rather than whatever the team ran last quarter.
How to Run Interviews That Uncover Real Jobs
Good jobs interviews feel like a reconstruction, not an opinion poll. You're asking someone to replay a specific episode where they struggled, switched, or improvised. Specific episodes produce evidence. General opinions produce polite fiction.
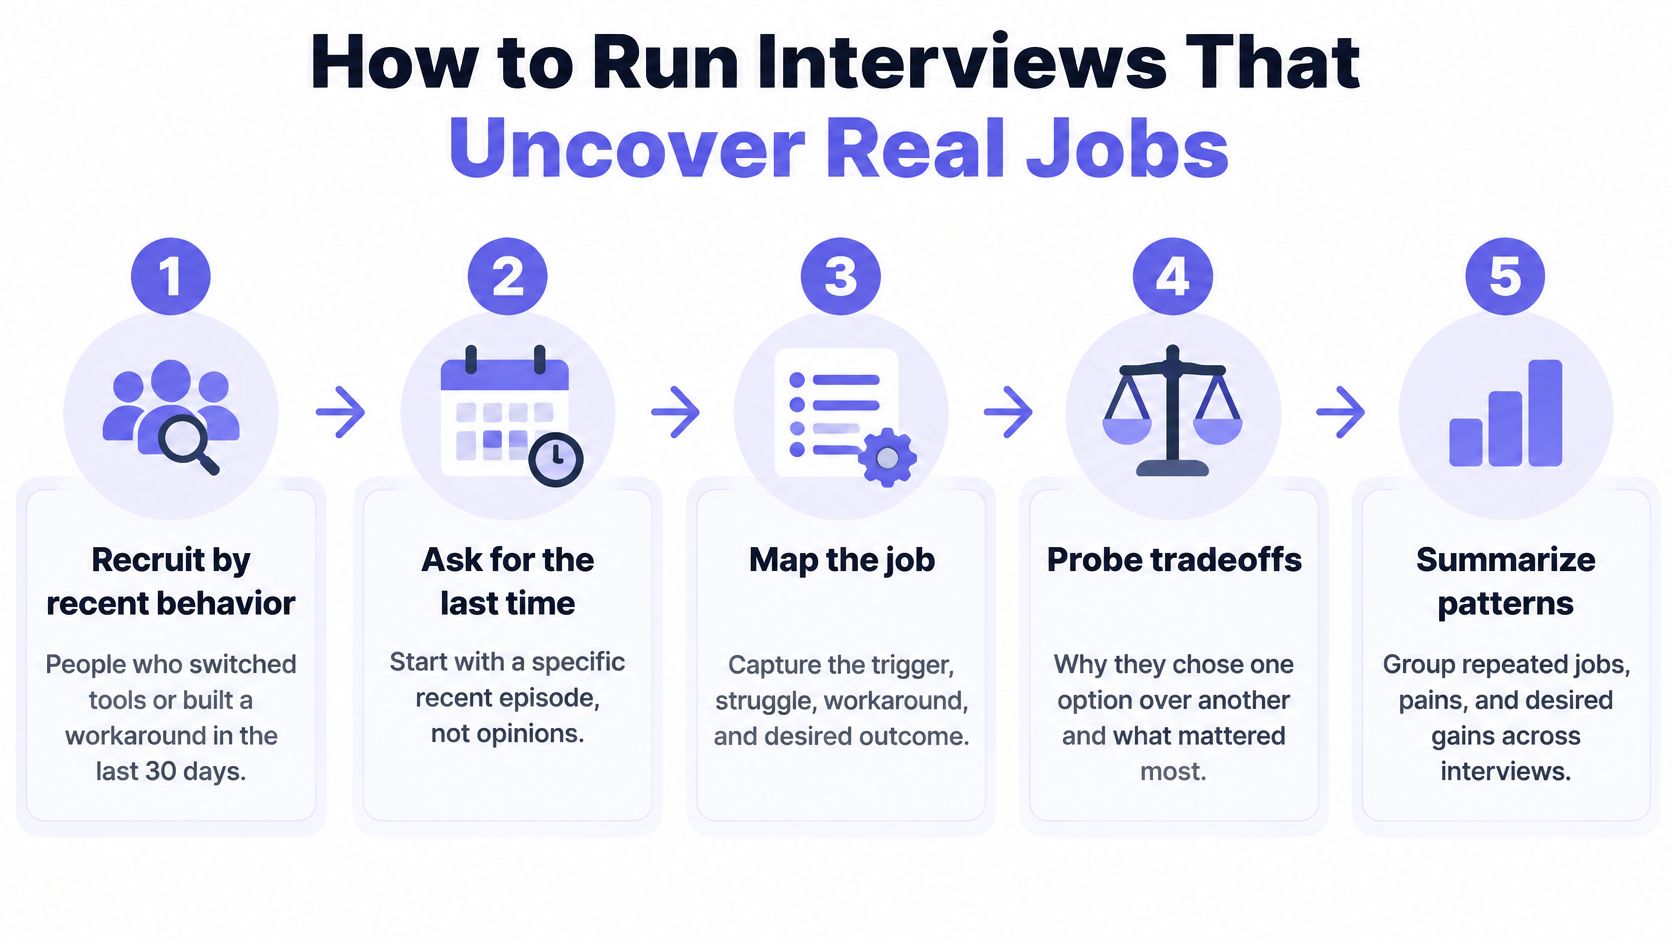
Step 1. Recruit by recent behavior.
- Find people who switched tools or built a workaround in the last 30 days.
- Skip demographic matching, because recent struggle predicts useful detail.
- Check product logs and support tickets for candidates first.
Step 2. Ask for the last time.
- Open with the last time they tried to finish the task.
- Ask them to walk through it step by step.
- Redirect gently when they drift into describing an ideal product.
Step 3. Probe the struggling moment.
- Ask what triggered the search for a better way.
- Ask what they tried first and what they gave up on.
- Note every workaround, since workarounds mark unmet needs.
Step 4. Separate outcome from request.
- Ask what progress they wanted, in their own words.
- Push past feature names to the result they expected.
- Record the exact phrasing, because you'll reuse it in need statements.
Step 5. Capture and tag as you go.
- Save verbatim quotes with the situation that produced each one.
- Tag each quote with a candidate need and segment.
- Treat untagged quotes as decoration, not evidence.
Step 6. Stop at repetition.
- End a round when new interviews stop producing new needs.
- A common working range is five to eight interviews per segment.
- If segment two contradicts segment one, keep both reads separate.
The Question That Ruins Interviews
Have you caught yourself asking whether someone would use a proposed feature? That question earns polite yeses and zero evidence, because imagining future use costs the respondent nothing. Ask instead what they did last Tuesday, what it cost them, and what they chose not to do.
What's left when the call ends matters as much as the call itself. A useful transcript contains four things: the situation, the stated struggle, the desired outcome, and the quote that proves it. From there, turning customer insights into testable product opportunities gets easier, because each insight already carries its context and its proof.
Field rule: If a participant can't name a specific day when it happened, you're collecting opinions, not jobs.
Kano Categories and Trade-offs That Shape Priorities
Ask customers to rank a feature list and they'll reward whatever sounds exciting that week. Meanwhile the baseline capabilities that keep them from churning score low, because nobody gets thrilled about things that work. Classification fixes that distortion before you measure preference.
| Category | What it means | Example | What to do |
|---|---|---|---|
| Must-be | Absence causes dissatisfaction, presence earns little praise | Login that works on the first try | Protect it before optimizing anything else |
| One-dimensional | Satisfaction rises and falls with performance | Page load speed | Tune it, then test trade-offs with conjoint |
| Attractive | Delight when present, not expected by the customer | A smart default that saves a setup step | Test with a small segment before committing |
| Indifferent | Customers do not care whether it exists | Extra theme colors | Deprioritize unless a segment asks for it |
| Reverse | Presence annoys some customers | A forced product tour for expert users | Offer an easy opt-out and check the segment |
The Two Questions That Sort Needs
For each candidate need, ask how the customer feels if the feature is present, then how they feel if it's absent. That pair is the whole trick. A single importance rating can't distinguish a must-be from an attractive feature, but the paired answers map cleanly to a category.
Does that distinction change real decisions? Constantly. A must-be with a mediocre importance score still goes first, because its absence creates churn risk. An attractive feature with loud fans can wait, because its absence creates no pain.
Where Conjoint Takes Over
Once Kano sorts the baselines from the differentiators, you still don't know how much each differentiator is worth. Conjoint analysis answers that by showing respondents controlled bundles of attribute levels and inferring the utility of each level from their choices. You learn what people will trade, not what they'll applaud.
Run the hybrid in order. Interviews define candidate needs, Kano classifies them, and conjoint quantifies the differentiators worth trading against each other. Then check segments before you rank anything, because an aggregate vote can hide a group whose must-be is everyone else's indifferent.
Reconciling What Customers Say With What They Do
A friend at a Series C company told me her team shipped their most requested integration, then watched activation barely move. The requests came mostly from power users who were already succeeding. The users dropping off during setup never asked for anything. They just left.
Why Stated Preference Misleads
Teams routinely treat interviews, surveys, NPS, satisfaction scores, and feature requests as reliable priority signals. The 2025 Loyalty Puzzle research agenda asks how predictive self-reported metrics are of future purchasing and loyalty, and how organizations can reconcile stated preferences with observed behavior. That question sits unresolved at the center of most roadmaps.
Why do people say one thing and do another? Sometimes they misremember. Sometimes they answer for an imagined future self. Sometimes the loudest segment is not the segment whose behavior you're trying to change.
| Expressed need | Behavior it should change | Where to check |
|---|---|---|
| Faster export from the reporting page | Export completed in the same session | Funnel step from export started to export completed |
| Scheduled CSV pulls for a weekly report | Saved or scheduled report use | Repeat-use count per account |
| Bulk edit of records | Fewer manual edits per task | Edit events and workaround macros per session |
| Richer dashboard filters | Saved views created after filtering | Filter events followed by saved-view creation |
The Behavioral Test for Every Need
For each expressed need, write the behavior it should change before anyone designs anything. Candidates include funnel progression, repeated workarounds, abandonment, support contacts, and usage frequency. Then pull the funnel for that step and check whether the segment asking for the change is where the drop-off happens. Understanding why users act the way they do helps you read those signals without overclaiming.
Next comes the causal check. Compare users who receive the change with comparable users who don't, so you can see whether the fix created value or merely served people who would have succeeded anyway. The same research agenda calls for methods that distinguish correlation from causation and measure true incremental value.
Be honest about the limits here. At Figr, we can't tell exactly why users drop off. Analytics context helps form hypotheses and review flows, and it should be paired with product context, research, and team judgment before you act.
Promote a need only when the expected behavior change shows up in the segment that asked for it.
Continuity, Trust and the Limits of Predicting Needs
Needs analysis often stops at the product surface, yet customers judge the whole journey. Salesforce Research surveyed 14,300 consumers and business buyers globally and found that 80% consider the experience a factor as important as products and services. The same survey found 79% expect consistent interactions across departments, yet 55% said interactions often feel like communication with separate departments, and 56% said they frequently have to repeat or re-explain information to different representatives.
Continuity as a Measurable Need
Those numbers name a need most feature lists miss: continuity. Map every handoff where a user restates information, from sales to onboarding or support to product. Treat each restatement as a requirement with a named owner, because fragmented data creates the friction customers remember. Tracking whether that friction fades takes patience, which is where how longitudinal research informs UX decisions becomes relevant for teams measuring change across quarters rather than launches.
When Anticipation Feels Intrusive
Predicting needs carries its own risk. According to Adobe's 2025 retail research, 69% of consumers want relevant offers or information at the right moment, while only 35% believe brands are succeeding, 87% expect responsible and secure handling of personal data, and 74% want clear disclosure when AI-generated content or recommendations are used.
What should you check before shipping a prediction? Run five checks: the data source, the consent boundary, the confidence level behind the inference, the fallback experience when you're wrong, and whether results differ for users with accessibility needs, other languages, young accounts, or little data. An accurate guess delivered opaquely can still erode trust.
In short, optimize for useful and trusted assistance, not maximum personalization.
Turning Findings Into Product Decisions
A folder of interview highlights won't survive a roadmap fight. You need structure that carries a need from raw quote to funded work without losing the reasoning along the way.
Research on Voice of the Customer in the ACM literature identifies three mechanics: identify customer needs, structure them into primary, secondary, and tertiary levels, then prioritize them for managerial or product decisions. That work also examines how many customers to interview, how many analysts should review transcripts, and whether focus groups or one-to-one interviews perform better.
Decompose Until It's Testable
Watch what structuring does to a vague need. The workflow should be easy sounds like a primary need, until you break it down. Secondary needs might include finishing fast and recovering from mistakes. Tertiary needs get measurable: task completion time, error recovery, discoverability, and support for specific edge cases.
Each surviving need should carry a traceable chain with six fields. Name the evidence source, the target segment, a measurable success criterion, the affected journey step, the validation method, and the rationale. If any field is empty, the need isn't ready for the roadmap. It's still a comment.
Score on Criteria Your Team Agrees On
- Frequency across segments: How many distinct groups hit this need, and how often?
- Strength of behavioral evidence: Does usage data confirm what people said?
- Severity of failure: What breaks for the customer when the need goes unmet?
- Design and engineering effort: What does a credible fix cost?
- Fit with strategy: Does solving this move a metric leadership already tracks?
Grouping observations by user impact, product risk, and effort lets the team review everything on one grid, which pairs well with efforts to rank backlog items by technical feasibility. Tools can organize this evidence, and we can use research notes and interview material as product context. Final research interpretation and prioritization stay with your team, because you know your customers and your constraints.
Decision rule: A need enters the roadmap only when every field in its chain is filled in.
Run Your First Needs Analysis This Quarter
You don't need a research department to start. You need one journey, one owner per step, and a closing date that survives the first planning meeting.
Step 1. Pick one measurable journey.
- Choose activation or first export, and name an owner and deadline.
Step 2. List the top three requests.
- Write the behavior each request should change, using the mapping approach.
Step 3. Run six to eight interviews.
- Recruit from the segment driving your metric and follow the interview procedure.
Step 4. Pull the same funnel.
- Check whether the requesting segment matches the drop-off segment.
Step 5. Classify with a Kano pair.
- Sort the top three candidate needs before anyone argues priority.
Step 6. Write the traceable chain.
- Carry the strongest need, fully specified, into the next planning cycle.
Context compounds as you work this way. A research note can inform a user flow, a PRD can inform edge cases, a product walkthrough can inform a redesign, and a design decision can shape future screens. The same discipline applies outside SaaS, since teams that build mobile-first pages for Shopify face the identical question of which shopper need deserves the first screen.
Before the quarter ends, your team should answer one question with evidence. Which expressed need, if met, would change the behavior you already measure?
Bring your interview notes, funnel data, and candidate needs into Figr and turn them into user flows, edge cases, and prototypes grounded in your actual product context. You'll keep the interpretation and prioritization calls, while Figr organizes the evidence chain from research to handoff. Start with one journey this quarter and see how defensible your next roadmap decision feels.