
The design file is called checkout-flow-final-v4, and it holds five rectangles, four arrows, and no branches. Every route in it succeeds. Nothing declines a card, expires a session, or sends a locked-out account to support.
Two weeks after launch, the pattern shows up in three places at once. Support tickets describe shoppers who never reach the confirmation screen. QA signs off because its cases only cover the drawn path. Analytics shows a funnel losing most of its users between two steps the diagram treats as adjacent. The map wasn't wrong about the happy path. It was wrong to present the happy path as the whole system.
The task flow vs user flow distinction usually gets taught as a vocabulary lesson: one is linear, the other branches. That's accurate and nearly useless on a Tuesday morning, because it doesn't tell you which artifact to open or when the linear one will mislead your team. What follows is the decision rule, the metrics that separate the two, and a way to check whether a clean diagram is hiding the states your users actually hit.
Task Flow and User Flow Side by Side
Readers often arrive with a practical question rather than a theoretical one: which artifact do I open, and what will it tell me that the other one won't? The comparison below answers that before any definition does.
Task flow and user flow compared
| Aspect | Task flow | User flow |
|---|---|---|
| Unit of analysis | One goal | One user's route across goals |
| Scope | A single operation | Entry point to outcome, across screens and stages |
| Structure | Ordered steps with decision points | Branching map with alternate paths, errors and exits |
| Primary question | Can the user complete this task? | Where does the journey stall or loop back? |
| Typical owners | QA, usability testing, acceptance criteria | Product, design, funnel and analytics review |
| Main evidence | Completion rate, time on task, errors | Conversion per transition, drop-off, loop-back frequency |
The same split holds visually: one artifact tracks a single goal in order, the other tracks a person across several goals and the decisions between them.
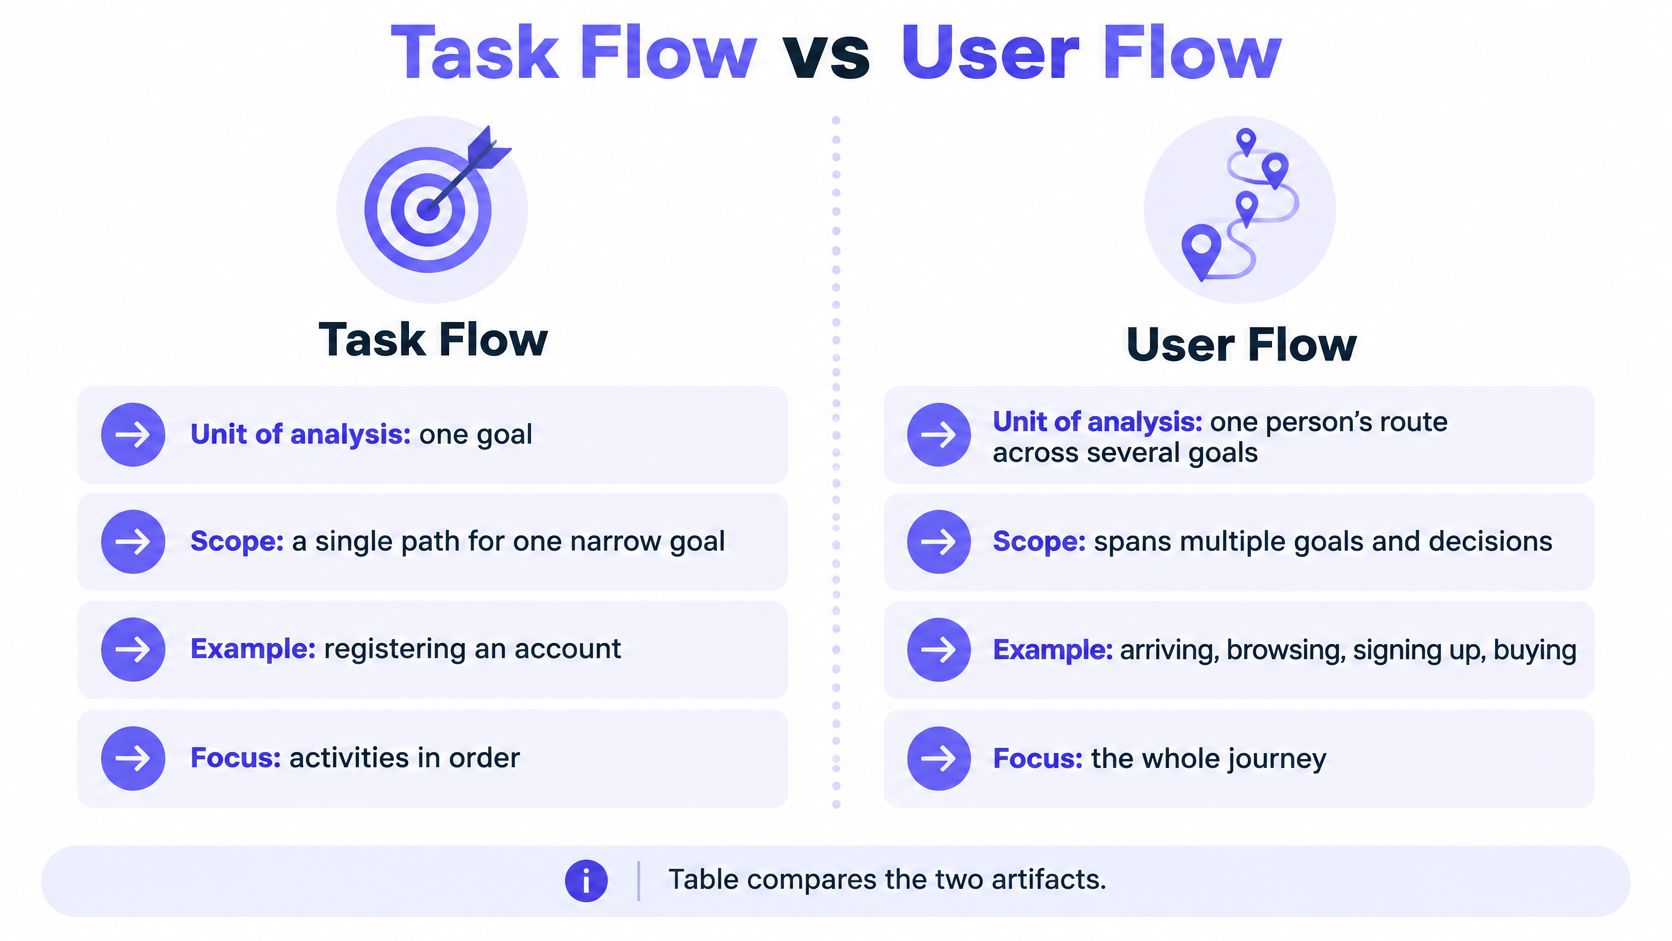
A task flow is the ordered set of activities that completes one narrow goal, from the trigger to the confirmation, including the decision points and error states that can interrupt it. A user flow maps how a person moves through a product from an entry point to an outcome, including the branches, alternate paths, exits and recovery routes available along the way.
People use the two labels interchangeably in standups, usually meaning "the boxes with arrows." That looseness costs time. A task flow can be evaluated on its own, without the surrounding journey, which is exactly what makes it useful for acceptance criteria and scripted tests. A user flow has to account for context, motivation, navigation and branching, which is what makes it useful for spotting friction between stages.
Working rule: A task flow tests whether one goal works. A user flow shows where people get lost on the way to it.
If someone asks you for "the flow" without naming which one, ask what decision the diagram needs to support. "Is this step completable" calls for a task flow. "Why does signup leak" calls for a user flow. Asking the question out loud takes ten seconds and saves a rebuild.
What a Task Flow Breaks Down and How to Map One
The ISO 9241-11:2018 standard defines a task as a "set of activities undertaken in order to achieve a specific goal," and that wording covers physical, perceptual and cognitive activity, not just clicks. A task flow takes one goal and lists those activities in the order a person performs them. It's the narrowest useful unit of analysis in product work.
Here's the shape it takes for registration.
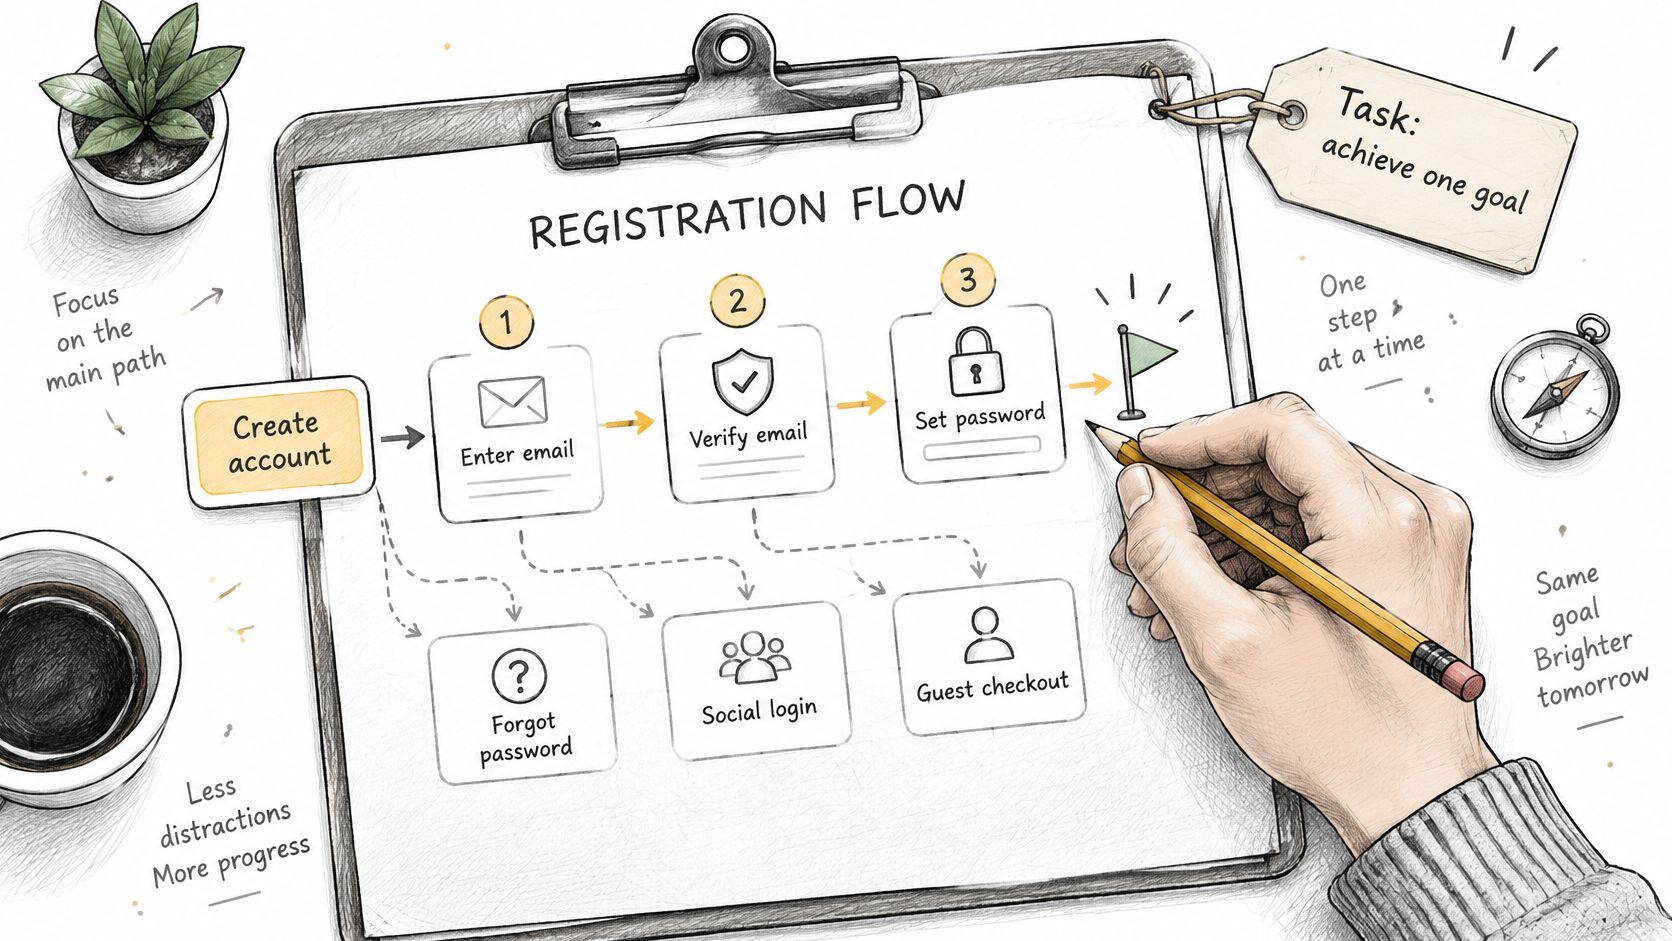
The goal is an active account. The activities are entering an email address, choosing a password, verifying the account through a link or code, and confirming the result. Four activities, one goal, a clear finish line.
The parts that make it testable
A sequence of boxes isn't a task flow until four things are written down.
- A success condition. One sentence naming the end state that counts as done, such as "account verified and the user signed in on the same device." Without it, two reviewers will disagree about whether a session passed.
- Ordered activities with their effort. Physical actions like typing, perceptual work like spotting an error message, and cognitive load like remembering a code across a device switch all belong in the list.
- Decision points. Branches where the system or the user makes a choice that changes what comes next.
- Error states with a way back. Each failure needs its own recovery route, or the diagram assumes nobody fails.
A hypothetical password reset shows the shape in practice: send the reset email, open the link, collect a new password and its confirmation, save it, confirm and sign in. Two decision points sit inside that sequence. The link has expired, so the user needs a fresh request. The typed address doesn't match an account, so the system has to decide whether to say so at all.
Building one that survives review
- Step 1. Define the goal and its success condition.
Name the end state before drawing anything.
The diagram is only testable against a stated finish line. - Step 2. List every activity with its effort.
Include the perceptual and cognitive demands, not only the taps.
A flow that ignores memory load will test well and fail in the field. - Step 3. Mark decision points and recovery paths.
Give every error state its own route back to the goal.
Borrow a starting shape from these flowchart process examples if the team is drawing from scratch. - Step 4. Review the diagram with users and subject-matter experts.
The U.S. Digital.gov guidance on user interaction design recommends diagramming every task and decision, then reviewing the model to find risk and frustration points.
Experts catch the states that look harmless on paper and painful in production. - Step 5. Specify focus order and a label for each step.
Write the keyboard sequence and the accessible name for every control.
A flow that only works with a mouse is incomplete, not simplified.
A task flow is only as useful as its boundary. Lock the goal, success condition and error taxonomy before comparing two variants, or the before-and-after numbers measure a change in scope rather than a change in design.
What a User Flow Covers Across the Whole Journey
Say a B2B product team maps a trial-to-paid journey. Three entry points feed it: a paid ad, a referral link and a direct visit. Two roles move through it: the admin who starts the trial and the invited member who logs in later. A failed card payment loops back to the billing screen, and the trial expiring without conversion counts as an exit. That's a user flow. One outcome, several legitimate routes, and states that live outside any single screen.
Branch types a reviewer should check
- Entry point. A paid ad, a referral link and a direct visit arrive with different intent and different prior knowledge.
- Role. An admin and an invited member see different screens, permissions and available actions.
- Account state. A fresh account, an expired trial and a suspended tenant can share the same screen with different controls enabled.
- Error. A declined card at the billing step is a state, not an edge case.
- Recovery. The route back from a declined card to a working payment method, including how many times a person will retry before leaving.
- Exit. Trial expiry without conversion is a path the map should draw, because somebody owns that outcome.
The Baymard checkout research shows why mapping has to reach past the task. It identifies separate reasons shoppers abandon: 40% leave because of unexpected extra charges, 18% because of forced account creation or a concealed guest path, 17% because the process is too long or complex, and 9% because their preferred payment method is unavailable.
A task-flow diagram of the payment step would catch none of the first two causes. Extra charges surface on a cart or shipping screen. Forced account creation happens a stage before payment. The failure begins earlier than the task being tested, which is the case for building the wider map before optimizing the narrow one.
In short, keep the entry point attached to the number. One blended conversion rate hides a branch that fails completely for a single cohort, and it usually fails for the cohort with the least patience for workarounds. A user journey mapping guide is useful here precisely because it forces the segmentation the funnel report collapses.
Metrics That Measure Each Flow Differently
The same analytics events can feed both artifacts and still answer different questions. The ISO 9241-11 usability framework separates usability into effectiveness (the accuracy and completeness of goal achievement), efficiency (resources spent relative to the result) and satisfaction (users' comfort with the experience). Task-level metrics operationalize the first two for a single operation. User-flow metrics aggregate the same measures across stages to expose where people drop out or loop backward. A UX measurement guide for product leaders is worth reading alongside this, because most reporting mistakes come from mixing the levels.
Metrics for task flows and user flows
| Metric | Task flow measure | User flow measure | Reference point |
|---|---|---|---|
| Completion rate | Successful completions per attempt | Share of users reaching the final stage | Compare against a published band, not a pass mark |
| Time on task | Median and 75th percentile seconds per completion | Days from entry to first success | Fix the measurement window before the first session |
| Errors and recovery | Errors per attempt and recovery rate | Loops back to an earlier stage per 100 users | Split recoverable from unrecoverable errors |
| Abandonment | Exits at a single step | Drop-off at each transition | A single-step exit count understates journey loss |
| Efficiency ratio | Successful tasks divided by total task time | Successful completions per session | Publish the denominator with the ratio |
| Path variation | One defined path, so not applicable | Distinct successful paths by segment | Count paths before judging a conversion rate |
One calculation you can check yourself
Task-level efficiency is usually written as successful tasks divided by total task time. If a round of testing produces 42 successful completions across 60 minutes of total task time, efficiency is 0.7 successes per minute. That figure is only comparable across rounds if the task boundary and the success condition stayed identical, which is why both belong in the test plan before the first session starts.
The benchmark band and what it leaves out
In 2024, the median task-success rate across 98 tree tests reviewed by Nielsen Norman Group was 62%, with an interquartile range of 37% to 83%, as Procrustes reported the 2024 figure. Tree tests measure whether people can find the right category, not whether they finish a full task, so treat the band as calibration rather than a pass mark. A checkout completing at 62% is in trouble. A first tree test landing at 62% is ordinary.
A shorter route isn't automatically the better one. Cutting screens can raise errors and lower confidence, and a longer path that improves accuracy wins even when the diagram looks worse. Judge the route on completion, error rate and satisfaction together, never on step count alone.
Choosing the Flow and Testing the Happy Path
The choice comes down to three questions, and none of them is about how the diagram looks.
- Is the sequence fixed by the system? If the platform enforces one order, such as a regulated verification step that can't be skipped, a task flow carries a real acceptance test.
- Do state, role or entry point create branches? Permissions, account status, remembered credentials and acquisition source all change the route. Where they exist, a single line is a summary, not a model.
- Is the team testing one goal or planning a journey? Testing one goal wants a task flow. Planning six weeks of onboarding wants a user flow, because the work spans sessions, reminders and returns.
Which flow to start with by situation
| Situation | Start with | Why |
|---|---|---|
| Regulated verification step with one required order | Task flow | The fixed sequence can carry a direct acceptance test |
| Multi-role admin panel with permissions | User flow | Account state and role decide which branches exist |
| Checkout with guest, card and wallet paths | Both | Task flow tests the guest purchase, user flow tracks the full funnel |
| Single form redesign with clear success criteria | Task flow | Completion rate and time show directly whether the change works |
| Multi-week onboarding or setup | User flow | Stages, reminders and returns happen across sessions |
| New feature from a PRD with no usage data | User flow first | Mapping branches reveals which critical steps need task tests |
When the linear diagram becomes a liability
Published comparisons describe a task flow as a single fixed sequence and a user flow as a path containing decisions, errors and alternate routes, as this comparison of user flows and task flows sets out. That description is correct and still doesn't settle when to pick one. The missing question is whether the happy path is representative at all.
Decision rule: Use a task flow alone only when the system enforces one materially invariant sequence. Otherwise it's a simplified view of a user flow, and the omitted branches belong written beside it.
Production route variation comes from account state, permissions, entry points, remembered credentials, failed validation and recovery behavior, not from abstract user choice. A clean five-box diagram that suppresses those states manufactures confidence. It tells QA the path is covered when it isn't, and tells support the ticket is unusual when it's structural.
Ranking branches so the map reflects risk
Every branch competes for design attention, and intuition is a poor referee. Rank each one on frequency, business impact, failure severity, accessibility impact and recovery cost. An account lockout may be rare and still need first-class treatment, because it blocks access entirely and the person affected has no workaround. A visually complex settings branch with negligible use and a safe fallback may not justify heavy investment, even if it looks impressive in a review.
The artifacts feed each other more than is often acknowledged. A research note can inform a user flow, a PRD can inform edge cases, a product walkthrough can inform a redesign, and a design decision can shape future screens. Keeping that pipeline visible is what stops two diagrams from contradicting each other in the same review. Figr asks clarifying questions, maps the current flow, identifies friction, lists missing states, explains tradeoffs, and gives the team a way to review the UX logic before committing to screens.
Accessibility turns part of the flow into a specification. The WCAG 2.1 keyboard accessibility requirements state that all functionality must work through a keyboard interface, with a narrow exception where the underlying function depends on a movement path, and that repeated navigation on a set of pages must keep the same relative order unless the user changes it. In practice: focus order through each step, an accessible label on every control, and no required action that depends on a pointer gesture alone. A task flow defines what to test and sessions show whether real users complete each step, which is the principle behind how Figr approaches usability testing.
Connect Task and User Flows Before Your Next Sprint
Checkout is the clearest place to watch the two artifacts cooperate, because the goal is unambiguous and the failure states are expensive. Take a hypothetical checkout that asks for 23 required fields by default. That sits close to the 23.48 form elements the average U.S. checkout displays, according to Baymard's ecommerce checkout usability benchmark, and the same usability testing found an effective checkout could be reduced to as few as 12 elements. Baymard puts average cart abandonment at 70.19%.
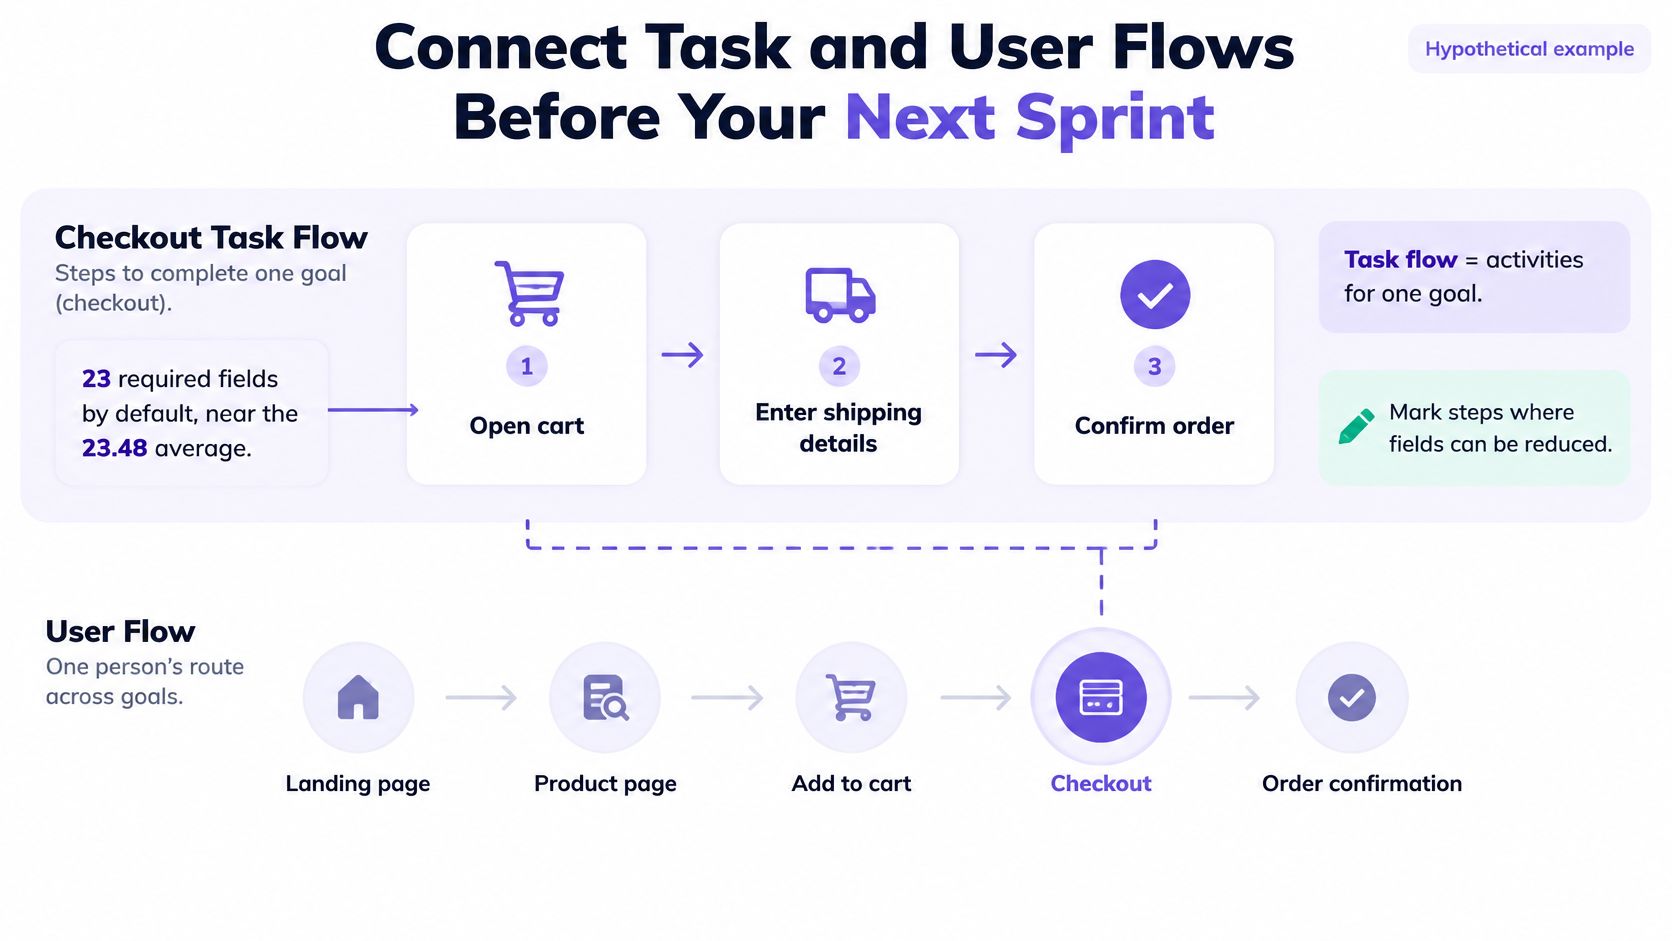
In this hypothetical, the team maps the guest purchase as a task flow, counts its inputs, and tests a 12-field version against the default while the user flow supplies the stages around it.
- Step 1. Pull funnel events for each checkout stage.
Compare drop-off by stage before choosing a design change.
Optimizing the payment screen when people leave at shipping wastes the sprint. - Step 2. Map the guest purchase as a task flow.
Write the success condition and every error state explicitly.
Guest checkout is the path most likely to be assumed rather than tested. - Step 3. Count required inputs against the benchmark.
Flag every field that could move to a later step or disappear.
Field count is the cheapest lever in the flow and the easiest to defend with data. - Step 4. Add recovery branches.
Cover validation errors and payment declines with their own routes back.
A decline with no visible next step is an exit, not a retry. - Step 5. Convert high-risk branches into user-flow nodes and QA cases.
Give each one a named owner before handoff.
A branch without an owner is a diagram decoration.
Coordination cost climbs with every role, payment method and entry point added. One shared branch map gives design, QA and analytics the same reference, which is far cheaper than reconciling three private mental models during a launch review. Booking that work is easier when the branch list doubles as the ticket list, and an agile sprint planning guide covers how to size it.
Figr can create user flows, state diagrams, edge case maps, and acceptance criteria before producing screens. Starting on the Free plan lets you test a single workflow, Starter suits one person who uses it regularly, and Max suits shared team work.
Frequently Asked Questions
Is a task flow the same as a user flow?
No. A task flow covers one goal and the ordered activities that complete it. A user flow maps a person's route across goals and stages, including entry points, branches and exits. The two get confused because both are drawn as boxes and arrows. The practical test is scope: if the diagram ends the moment a single goal completes, it's a task flow.
Which flow should a small team build first?
Start with the user flow when requirements are new, then test the critical steps as task flows. A small team usually doesn't know which branches exist yet, and mapping the journey exposes them. Once two or three steps look risky, a task flow with a stated success condition gives you something measurable. Building task flows first tends to lock in assumptions nobody has checked.
How many branches belong in a task flow?
Include every branch that changes whether the goal completes, such as validation failures, permission blocks and recovery states. Move the rest to the user flow. A task flow with twelve branches stops being readable and stops being testable. If a branch can't affect the completion outcome, it's context rather than part of the task.
How do I decide whether a branch deserves a test?
Rank it by frequency, business impact, failure severity, accessibility impact and recovery cost. A rare account lockout still deserves first-class treatment because it blocks access entirely. A visually complex settings path with negligible use and a safe fallback may not justify design investment. The ranking replaces intuition with a list the whole team can argue about openly.
Does a task flow replace usability testing?
No. The task flow defines what to test, and sessions show whether real users complete each step. A diagram can be internally consistent and still describe a sequence people never follow. Treat the flow as the test plan and the session as the evidence. Neither artifact substitutes for watching someone attempt the goal under realistic conditions.
Teams don't need another diagram. They need the branch list that the tidy diagram left out, ranked by what it costs when it fails. Figr maps your current flow, surfaces the missing states and edge cases, and turns them into acceptance criteria and test cases before anyone opens a design file. Bring it your next checkout, onboarding or permissions flow and see which branches your original map never drew at Figr.