

The roadmap review ends the way it usually does. Five ideas sit on the board, each with a champion and a slide, and nobody in the room can say why idea three should beat idea five except that it feels further along. The arguments are reasonable. They're just being made in different currencies: one in support tickets, one in a competitor's launch, one in a revenue number nobody has checked.
That gap has a cost, and it surfaces later as rework. PMI Montréal, citing The Standish Group and related statistical databases, reports a 28% project success rate, a 45% average cost overrun, a 63% average schedule overrun, and a 33% average shortfall in requirements (PMI Montréal on the business case). Those figures describe projects in general rather than your team. They still point at the cheapest place to fix a project, which is before it has a budget.
A shared opportunity assessment template closes part of that gap. It puts every candidate into the same record, with the same fields, the same evidence labels, and the same four possible outcomes, so a leader can compare two ideas from two product lines without translating. This piece treats the template as an evidence-to-decision record: every assumption carries a source, a confidence level, and a test that could kill the idea. What follows is the ten-field version, the market math underneath it, a published scoring rubric, and one worked call you can copy.
Fields in an Opportunity Assessment Template
An opportunity assessment template is a decision document that turns an uncertain idea into a comparable, evidence-based investment case. That definition carries obligations. A foundational version records the problem or opportunity, the target customer, the alternatives, the objectives, evaluation criteria, financial implications, risks, implementation requirements, a recommendation, and next steps, which is close to the structure PMI Montréal sets out in its business case guide.
Here are the ten fields, what goes into each, and the decision each field forces.
| Field | What to write | Decision it forces |
|---|---|---|
| Problem | The unmet job in the customer's words, not the feature name | Is this a real problem or an attractive solution? |
| Target customer | Named buyer, segment, and how often the problem occurs | Who would feel the change, and who would not? |
| Alternatives | Do nothing, manual workaround, competitor, or adjacent tool | What are people already doing instead? |
| Objective | Measurable outcome and acceptance criteria | What result would count as success? |
| Evidence and assumptions | Source, date, sample, observed behavior versus stated intent, and confidence | What is known, and what is still a guess? |
| Market inputs | TAM, SAM, and SOM with the formula and sources | How much of the market can this team actually reach? |
| Cost and timing | People, budget, dependencies, and a rough window | What must be spent to learn or to ship? |
| Risks and blockers | Privacy, security, accessibility, regulation, and operational load | What could make the opportunity unattractive even if demand is real? |
| Recommendation | Proceed, test, defer, or stop, with the reason | What decision is being asked for now? |
| Next step | Owner, validation test, and the result that would change the call | What happens in the next two weeks? |
Three rows carry most of the weight
The alternatives row is where assessments cheat. If the only option listed is a named competitor, the team has skipped the two most common answers in real buying decisions: doing nothing, and a spreadsheet that one person maintains by hand.
The evidence and assumptions row separates this document from a wish list. Every claim gets a source, a date, a sample size, and a label saying whether it reflects observed behavior or stated intent.
The next step row is what stops the document from ending in a summary nobody acts on. It names an owner, a test, and the specific result that would flip the recommendation.
Copy the ten rows into a shared doc before anyone debates a score. A number argued without a shared field behind it is an argument about taste.
Size the Reachable Market with Visible Math
Record three nested numbers, not one industry total. A single figure lifted from a vendor report tells a reader nothing about whether this team can reach any of it, and a template that asks for one number invites exactly that.
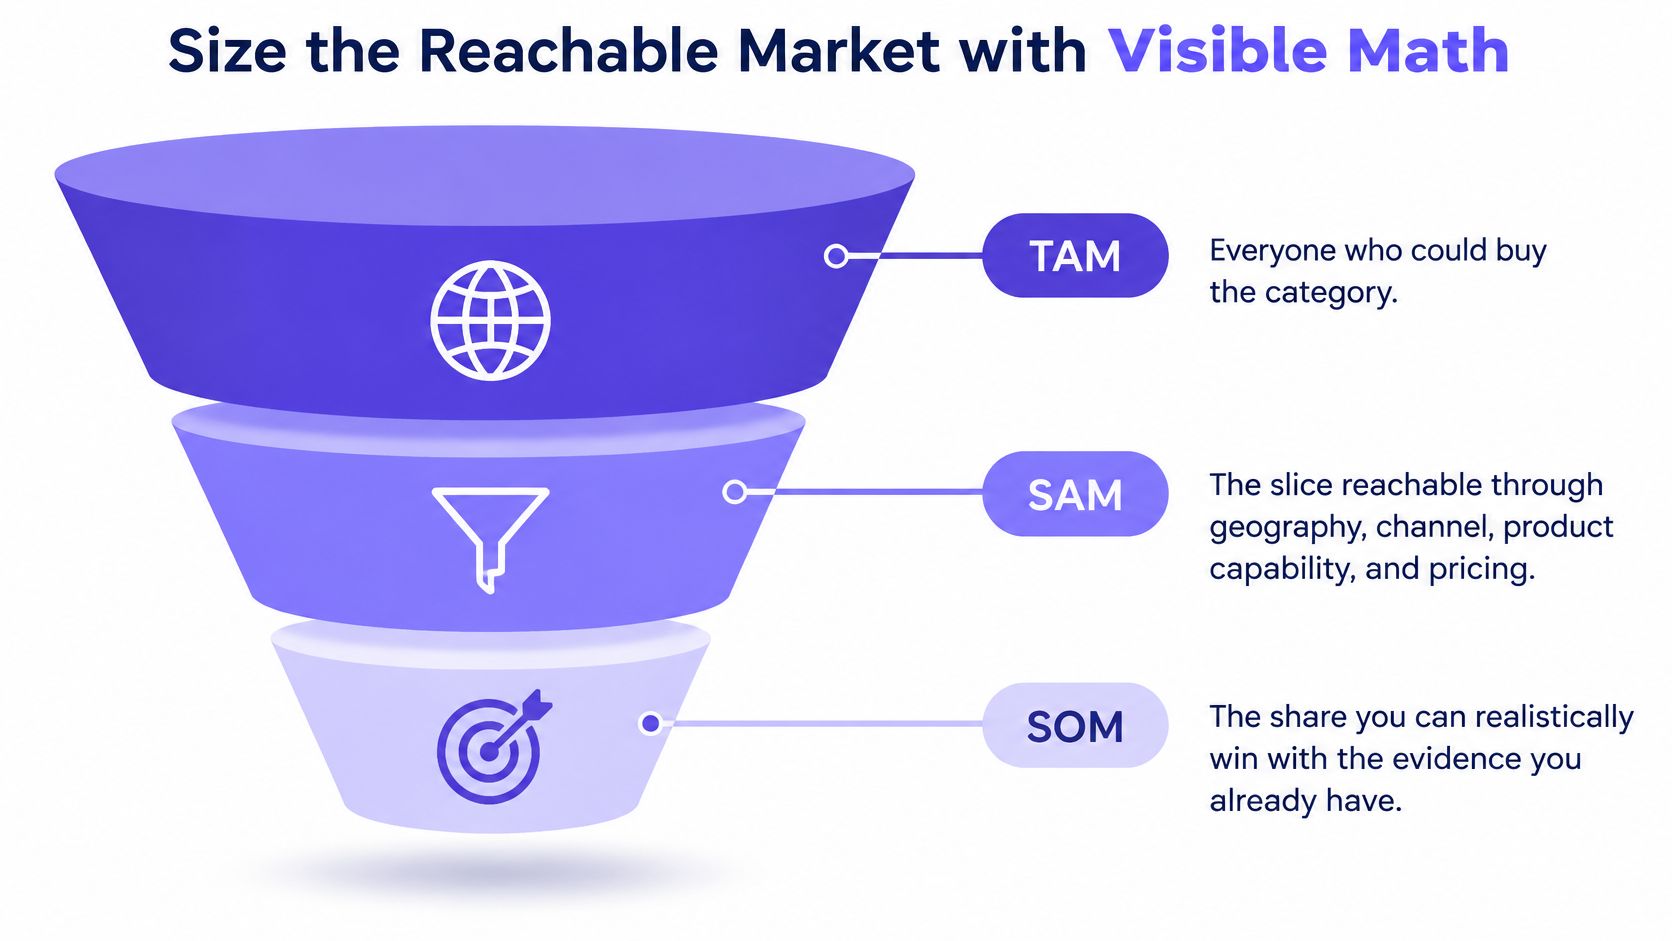
The nested set is TAM, SAM, and SOM. TAM is everyone who could theoretically buy the category. SAM narrows that to customers reachable through your geography, channels, product capabilities, and resources. SOM is the portion you can realistically capture in an initial planning period, as the Boston University Innovation Pathway sizing guide defines the three measures.
Build the model in both directions. Top down starts broad and cuts by eligibility, geography, and channel. Bottom up multiplies eligible customers by purchase frequency and price. The same guide shows the arithmetic: 8,000 eligible businesses at a $500 annual subscription produce $4 million in annual addressable revenue.
That's a teaching case, not a measured market, and the template should say so in the cell. Run the same base three ways and name what has to hold for each figure.
| Scenario | Eligible customers | Annual price | Annual revenue | Assumption that must hold |
|---|---|---|---|---|
| Conservative | 2,000 | $500 | $1 million | Only a quarter of the base list is reachable |
| Base | 8,000 | $500 | $4 million | Count, price, and annual purchase frequency are all valid |
| Upside | 12,000 | $700 | $8.4 million | Broader reach and a higher accepted price |
Put a source and a date beside every input, and mark the cells that are assumptions rather than observations. Frequency matters as much as size here. A population of millions with a cheap, rare problem loses to a segment of thousands with urgent weekly pain, which is the tradeoff the Boston University guide flags when it weighs problem scale against problem frequency.
Then circle one input: customer count, price, penetration, retention, or reach. Whichever would shrink SOM enough to change the decision is the assumption to validate first, and it needs an owner by name. Teams that need to compare vendors or feature gaps rather than count buyers can browse competitive matrix template options before locking the market row.
How to Score and Choose What Comes First
A score compares opportunities that used the same evidence standard, and it never overrides a blocker. A legal ban, a missing buyer, or a security review that rules out the data you need ends the conversation before arithmetic starts. Get that ordering right and the number becomes useful instead of theatrical.
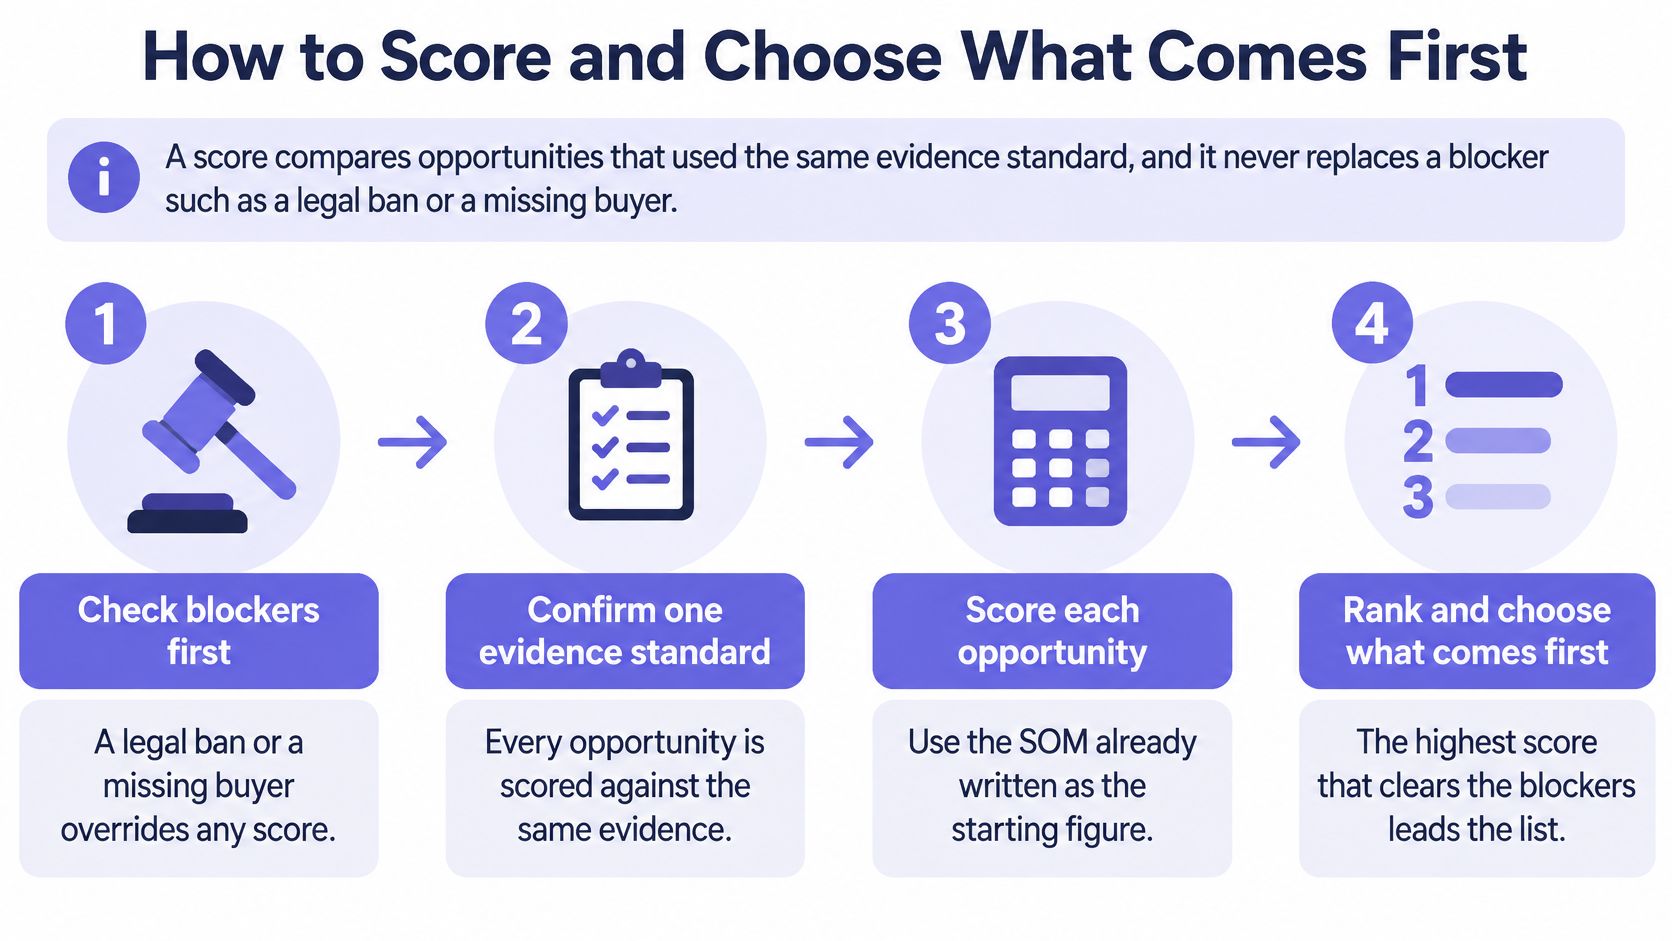
Publish the weights before anyone scores anything, and make them sum to 100. A default that holds up across most B2B software portfolios: problem frequency and severity at 25%, willingness to pay or switch at 20%, strategic fit at 15%, reachable market at 15%, feasibility at 15%, risk plus total cost at 10%.
| Criterion | Weight | Score of 1 | Score of 5 | Evidence required |
|---|---|---|---|---|
| Problem frequency and severity | 25% | Rare or vague complaint | Named buyer hits the problem weekly or daily | Interviews, support themes, or usage |
| Willingness to pay or switch | 20% | Polite interest only | Pays, preorders, or already pays for a workaround | Pricing test, pilot, or observed spend |
| Strategic fit | 15% | Off the current strategy | Advances a stated goal or OKR | Strategy note or goal owner |
| Reachable market | 15% | Only a broad TAM | Sourced SOM for the planning window | Bottom-up customer, price, and reach math |
| Feasibility | 15% | Blocked by skills, data, or integrations | Deliverable inside current budget | Engineering and dependency review |
| Risk and total cost | 10% | Harm, hidden support, or unclear owner | Known owner, rollback, and cost range | Privacy, accessibility, security, and support estimate |
Five moves that keep the score honest
- Frame the decision before gathering anything. Name the audience, the problem, the alternatives, the criteria, the weights, and the nonnegotiable constraints, in that order, as Ramotion's opportunity assessment walkthrough lays out.
- Tag every input as observed or stated. A support ticket count is observed. "Buyers said they'd pay" is stated, and it scores lower on this rubric.
- Attach a source, date, and segment to every number. If a cell can't hold all three, the score is a placeholder dressed as a finding.
- Multiply and divide once. Score times weight, summed, divided by 100. No reweighting after the result appears.
- Apply the band instead of negotiating it. 4.0 or higher with observed evidence and no blocker means proceed to a bounded build. 3.0 to 3.9, or one missing assumption that could kill the idea, means test. High fit with no capacity means defer. Below 3.0, or a failed willingness-to-pay test, means stop.
Carry the winner into building a product roadmap with its confidence level attached, so the plan shows which bets rest on observed evidence and which rest on stated intent.
Working default: these weights are a starting point a team publishes and keeps, not a law. Change them between cycles, never in the middle of a comparison.
A Worked Call on a Guided Setup Idea
Imagine a product manager reviewing a guided setup idea for a B2B SaaS product used by operations leads. New accounts stall in the first week, support keeps answering the same setup questions, and the proposal is a checklist inside the product that walks a new workspace through configuration.
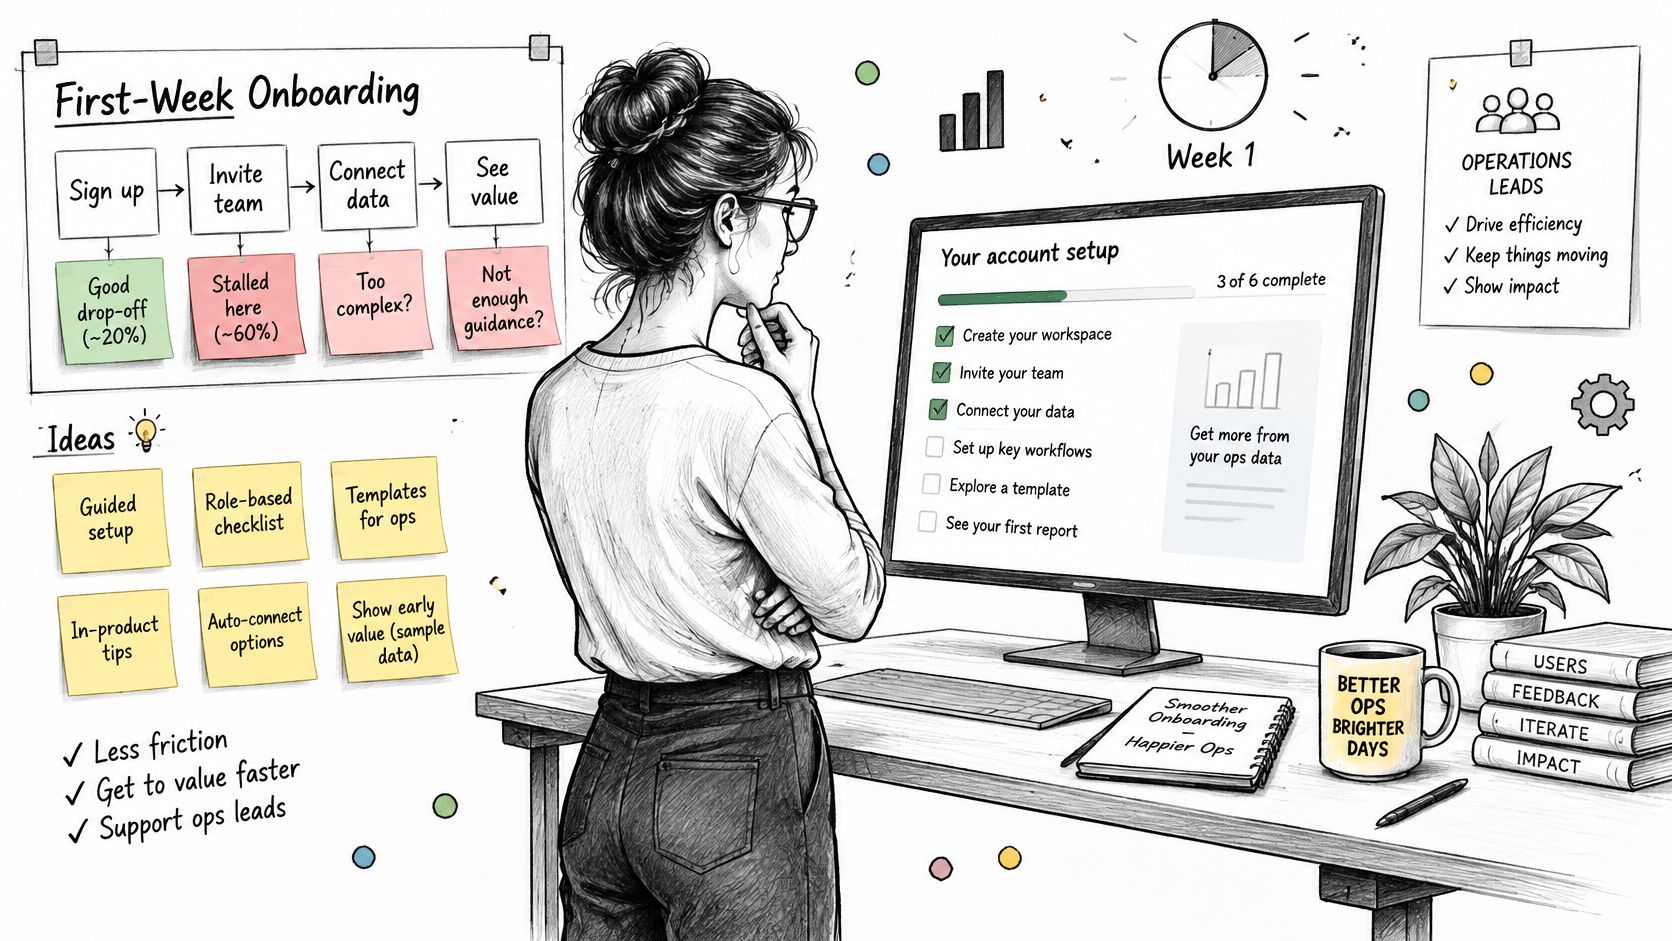
The evidence is uneven, which is the whole point. Twelve recent support tickets cluster on the same setup steps. Six interviews with operations leads describe the stall without being prompted. The current workaround is a shared spreadsheet one person on each account maintains. What's missing is any behavioral test of payment: no checkout, no preorder, no paid waitlist.
Pain looks strong. Willingness to pay is stated rather than observed, and the opportunity assessment framework from Find Startup Ideas sets a behavioral bar for both: a defined buyer who describes the problem unprompted, hits it weekly or daily, and already pays for a workaround, with stronger economic value when buyers accept a price at checkout or join a paid waitlist than when they merely say they would pay.
Score it. These are illustrative numbers, not a real customer result: problem 5, willingness 2, fit 4, reachable market 3, feasibility 4, risk 3. Apply the weights. 5 × 0.25 = 1.25, 2 × 0.20 = 0.40, 4 × 0.15 = 0.60, 3 × 0.15 = 0.45, 4 × 0.15 = 0.60, 3 × 0.10 = 0.30. The weighted total is 3.60.
That lands in test, not proceed. So the next step is a two-week pilot with 20 new workspaces measuring setup completion, not a full build. Look at the failure boundary beside it: if a paid waitlist converts under the bar set in advance, or a security review blocks the account data the checklist needs, the call flips to stop or defer, and no amount of interview enthusiasm reverses it.
In short, a clear problem with unpaid interest is a learning bet, and a two-week pilot is what buys the information at the lowest price.
Teams that take this route usually find the constraint sits in the first session rather than the feature, which is why onboarding advice for SaaS product leaders tends to change what the pilot measures.
Evidence Rules and Mistakes That Skew the Call
The gap isn't in the field list. It's in what the field list refuses to say. Common templates cover the problem, the target market, the alternatives, the differentiator, the metrics, the risks, and a go or no-go recommendation, yet they rarely specify how to tell customer demand from internal enthusiasm, how to record confidence, or what evidence would change the recommendation, as this analysis of a modern product opportunity template points out. A 2025 survey cited there reported that 98% of product managers use AI at work, only 39% had received job-specific training, and 78% reported using AI agents.
That last set of numbers cuts against the obvious conclusion. Faster drafting doesn't produce better cases. It produces cases whose prose no longer signals where the guesses are, because a generated paragraph reads as confidently as a verified one.
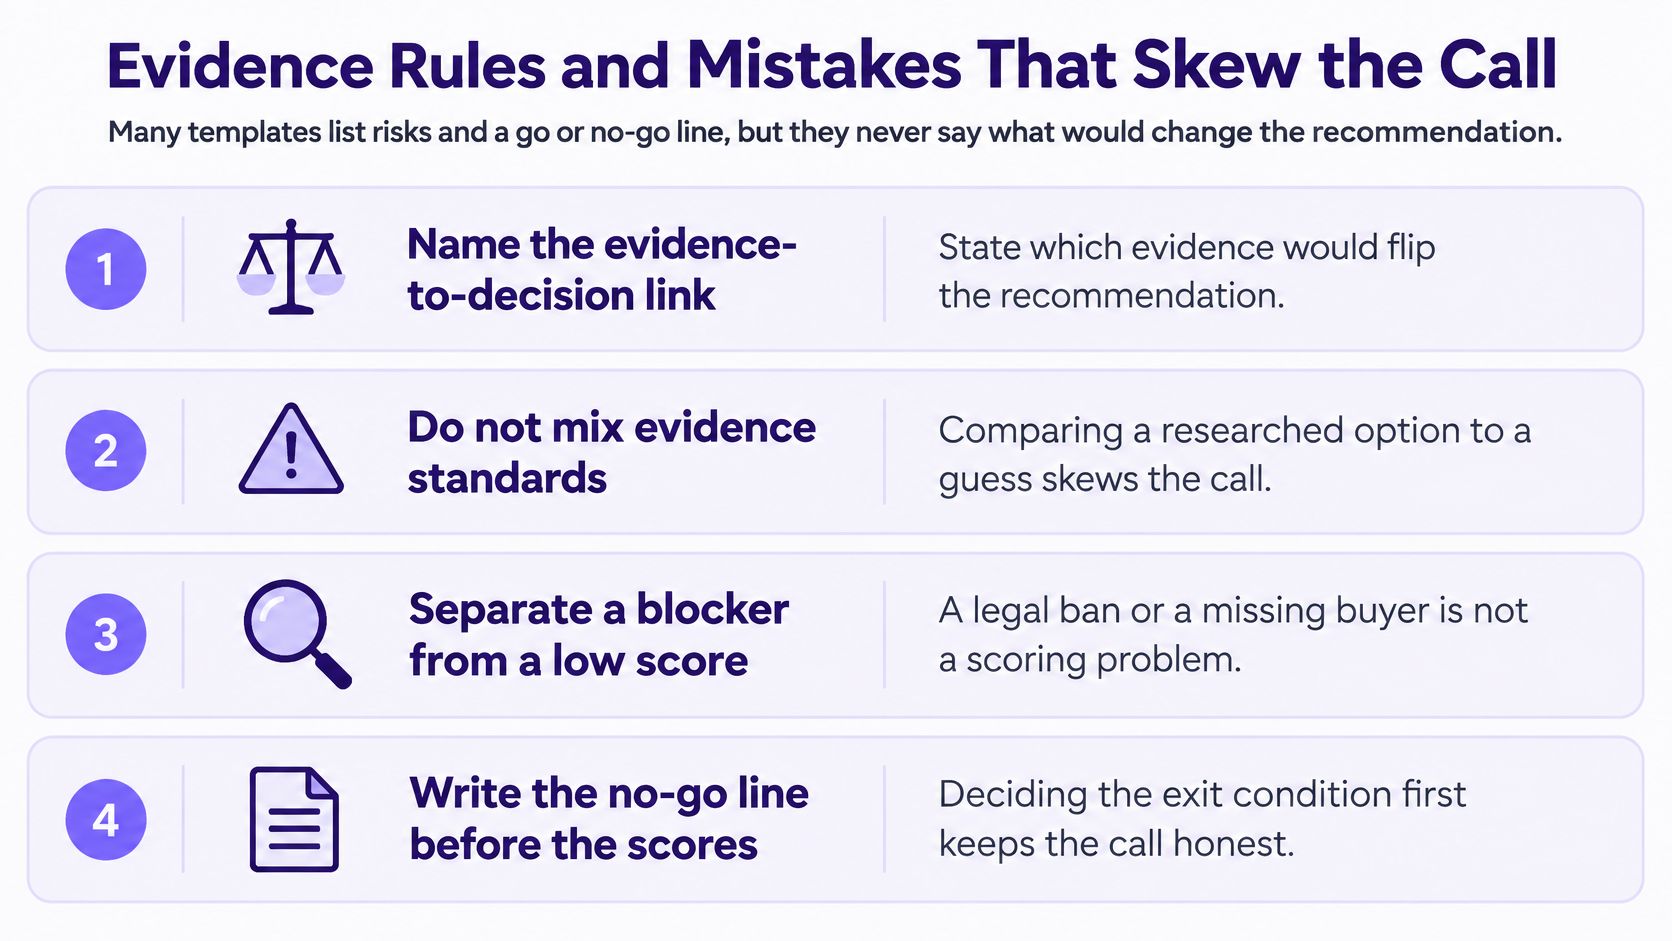
Set the thresholds before the debate, and write them into the template as rows rather than principles.
- Discovery can proceed on a sharp problem statement and a named segment. You're buying information, not capacity.
- A pilot needs one behavioral signal, such as a paid workaround, a completed prototype task, or a checkout attempt from a real buyer.
- Full investment needs observed willingness to pay plus a delivery path engineering has reviewed for budget and blockers.
Five mistakes survive the ten fields if nobody watches for them. Internal excitement gets scored as demand because the room agrees. The confidence column stays blank because filling it feels like admitting doubt. Privacy, accessibility, support, and maintenance costs hide inside a feature estimate. The pre-mortem gets skipped because the team is already tired of the idea. And the document reads finished early, because a fast draft looks like a considered one.
Attributed context for AI-enabled ideas comes from a separate 2025 product-operations survey: 34% of respondents hesitated to adopt AI over data-privacy or intellectual-property leakage concerns, 28% over cost or unclear ROI, and 27% over a lack of trust in AI recommendations (the Inspired product opportunity assessment reference). Those are governance costs, and they change whether an opportunity is attractive at all.
The basic gist is this: confidence is a field, not a vibe. Teams that want sharper inputs on the assumption side can borrow structure from user research methods rather than inventing a house style per document.
Write the exit condition first. One week, one question: what evidence would make us stop? An answer nobody can state out loud is a sign the case isn't ready for a budget.
Questions Teams Ask Before They Adopt It
Five questions come up every time a team moves from scattered documents to one shared template.
How is this different from a business case?
An opportunity assessment chooses which unmet need deserves attention, while a business case funds a defined project. The neighbors get confused constantly. Product discovery asks what the team should learn about customer needs and possible solutions, idea evaluation tests whether a proposed solution is promising, market sizing estimates scale, and prioritization sets order, as the distinction between opportunity assessment and discovery explains.
When should the team stop instead of test?
Stop when a nonnegotiable fails or when disconfirming evidence lands on the problem itself or on willingness to pay, even if every other score looks healthy. A legal block, a missing buyer, or a paid waitlist that converts near zero ends the opportunity. Testing is for uncertainty you can retire in two weeks, not for doubt you're hoping will fade.
Who should fill the template?
The product manager owns the document. Design, research, engineering, and a commercial partner supply the evidence in their area, and one executive sponsor accepts the decision. Owner means the person who keeps the file current and defends the labels, not the person who writes every word alone.
How often should it be updated?
Reopen it when a killer assumption changes, or at the next monthly portfolio review. Not after every interview. Constant revision turns a decision record into a diary, and diaries don't compare well across a portfolio.
Can one template compare different product lines?
Yes, if the weights, evidence labels, and planning window stay the same across lines. Local constraints belong in the risks row as blockers, where they can override a score, rather than folded into a high suitability number where nobody can see them.
Run One Live Opportunity This Week
Pick one opportunity already fighting for the next sprint: a real candidate with a sponsor, a budget line, and a decision that is contested. Block 90 minutes with the people who hold the evidence, copy the ten fields into a shared doc, and work in this order.
- Write sources before opinions. Every number gets a source and a date in the same cell. Anything the team cannot source stays blank and is labeled a guess, because a blank cell is useful information while a confident guess is not.
- Score with the published weights. Compute the weighted total in the room, out loud, so nobody has to trust a private spreadsheet afterward.
- Leave with one of four words. Proceed, test, defer, or stop, written next to the result that would reverse it.
Then zoom out once. As more teams, and more AI-drafted briefs, arrive in the same roadmap review, inconsistent cases cost coordination rather than formatting. A leader reading ten documents built to ten different standards cannot tell which bets share evidence and which merely share confidence, so the portfolio goes to whoever presents best. The template exists to remove that advantage.
After the human call is made, Figr can carry the same record forward instead of restarting it: it groups observations by user impact, product risk, and design effort, drafts PRDs and test scenarios from the evidence you just scored, and holds research notes and interview material as product context. Final interpretation and the priority call stay with your team. The same discipline of synthesizing evidence before building UX applies here. The assessment decides what is worth building; the artifacts that follow should keep the reasoning attached.
The finish line is modest and concrete: one completed template in the roadmap doc before the next review, a named owner, and a visible kill criterion. One honest record beats five polished slides.