

Collecting more responses won't fix a study that asked the wrong people, asked them badly, or transformed their answers incorrectly. That is the central trap in non sampling errors examples: teams chase a larger sample while the flaw sits in the contact list, the wording, the moderator, or the spreadsheet. Sampling error shrinks as your sample grows. These errors don't.
A product team can defend a satisfaction score because thousands of users answered, without checking who never received the survey, whether frustrated customers refused it, or what filter shaped the final number. That false certainty feeds a roadmap, triggers a redesign of a flow that was never broken, and hides the segment leaving. A precise margin of error doesn't help when the estimate itself points the wrong way.
Auditing where error enters beats collecting another round of similar answers. The seven patterns below trace each failure to a specific point in the pipeline: the frame, the respondent, the question, the interviewer, memory, processing, or the instrument. Each comes with a check you can run on Monday morning before you trust the result.
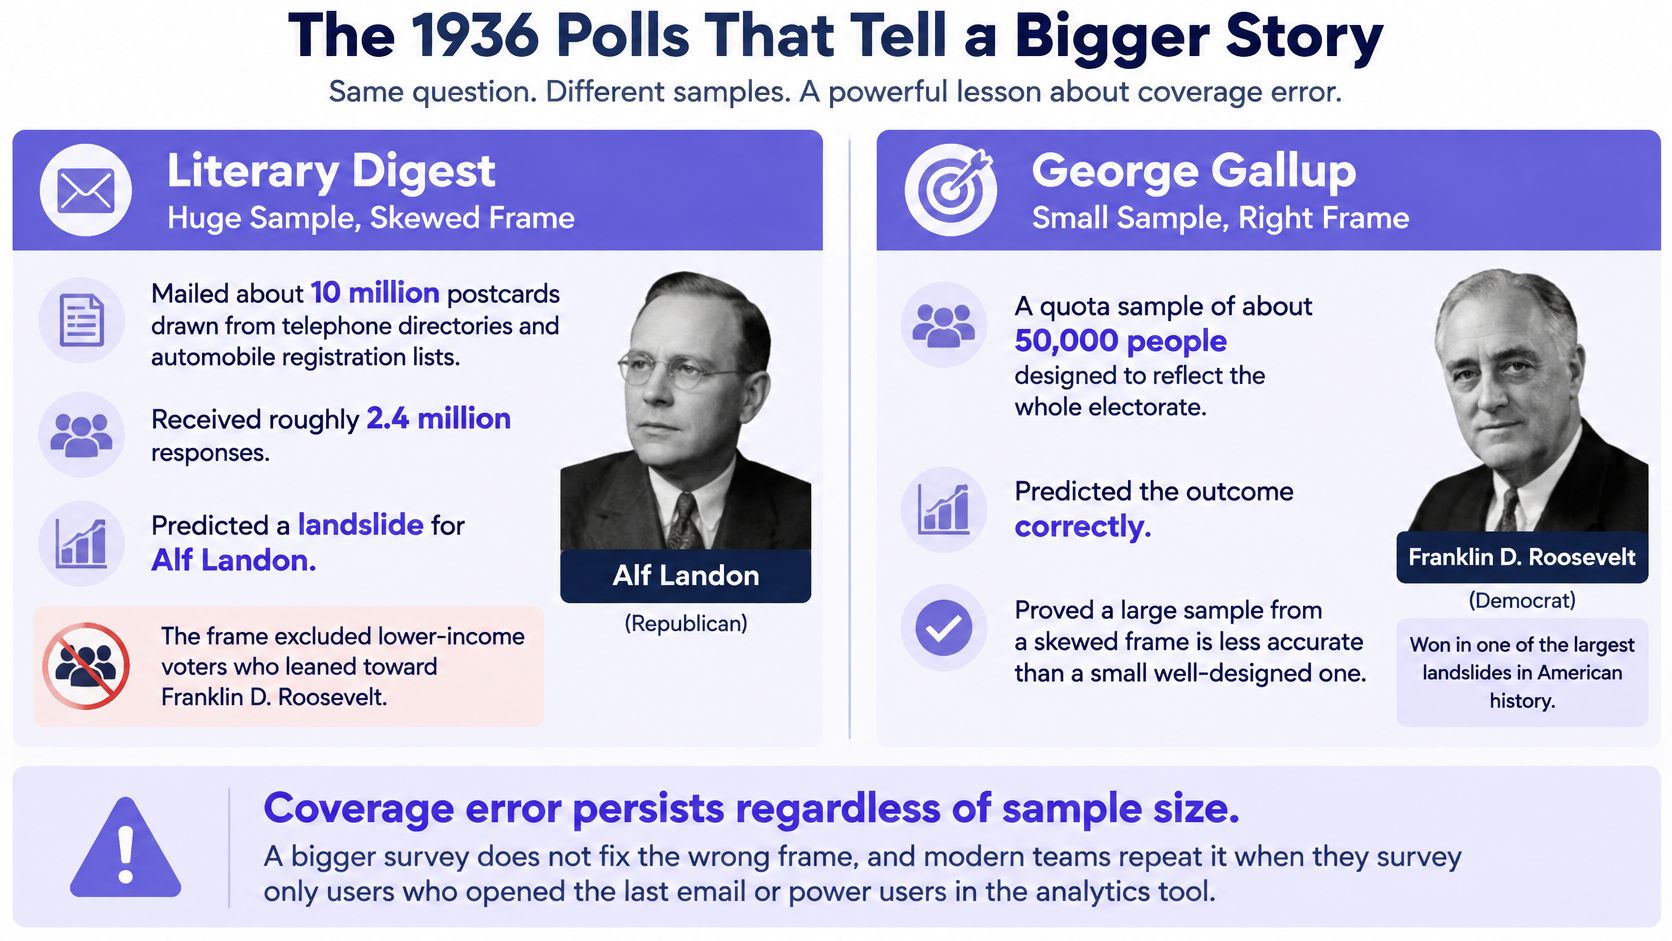
1. Coverage Error and the 1936 Literary Digest Poll
The Literary Digest mailed about 10 million postcards and received roughly 2.4 million responses, then predicted Alf Landon would defeat Franklin D. Roosevelt. Roosevelt won. The magazine had built its frame largely from telephone directories and automobile registration lists, sources that leaned wealthier during the Depression. George Gallup's much smaller, carefully designed effort got the election right.
Who never had a chance to speak? That's the coverage question. The U.S. Census Bureau's ACS handbook defines coverage error as a mismatch between the population you should study and the units represented in your sampling frame. Undercoverage removes eligible people before selection begins, while overcoverage gives ineligible or duplicated units a chance to enter.
The Monday morning frame audit
- Compare the frame with the population: Put your respondent attributes beside your full user base. Look for missing tenure bands, plans, regions, devices, and churned accounts.
- Recruit through more than one door: Combine in-app prompts, email, support follow ups, and churned user outreach. One channel rarely represents everyone.
- Hunt for duplicates and dead records: Remove repeated accounts and outdated contacts before fieldwork starts.
A SaaS onboarding survey sent only to users who completed setup offers a tidy modern version. It can't explain why people abandoned setup in week one, because the very people who hold that answer sit outside the frame.
2. Social Desirability Bias and the Bradley Effect
Tom Bradley led pre election polls in the 1982 California governor's race, then lost narrowly to George Deukmejian. Researchers still debate the explanation, but social desirability remains a leading candidate. Some voters may have offered the answer that sounded acceptable rather than the choice they later made privately.
The basic gist is this: when respondents can guess which answer earns approval, the study starts measuring self presentation. Why would your usability participant be different? A moderator from the product team asks whether a redesigned checkout feels easy, the participant smiles and agrees, and analytics later shows abandonment rising.
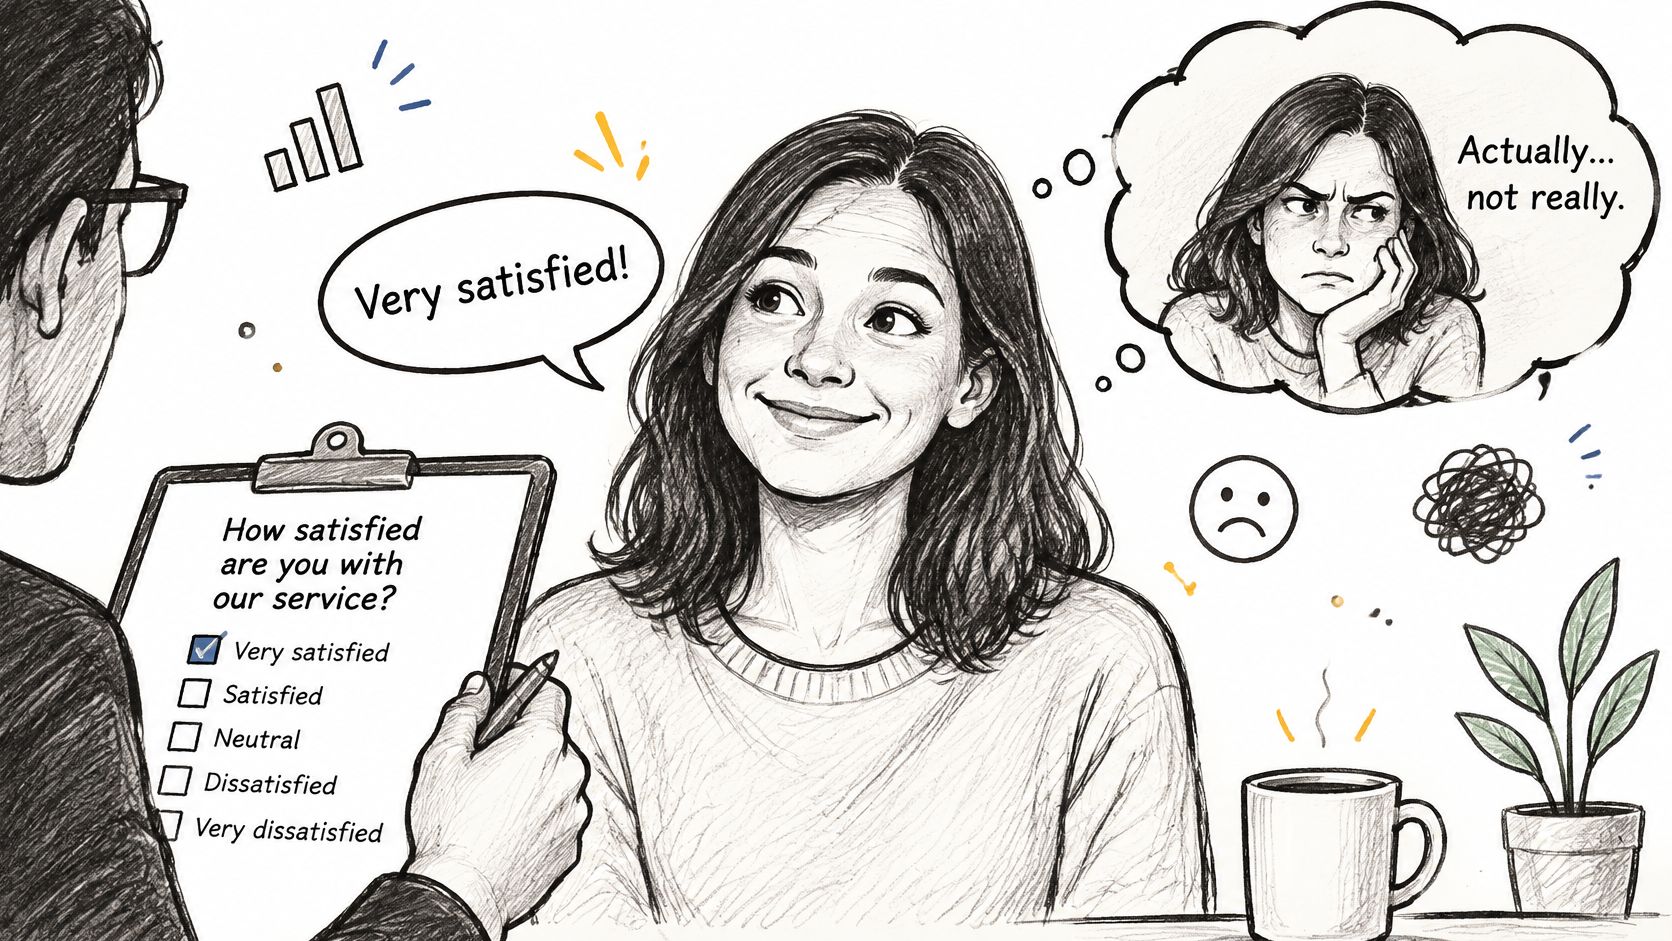
Separate polite stated opinion from observed behavior. Use anonymous or unmoderated formats for sensitive topics, and tell people plainly that criticism helps. Ask when they last completed a specific task instead of asking whether they would use a feature. Pair every rating with completion, repeat use, error, or abandonment data.
This discipline also improves focus group research for product teams, where one confident voice can pull the room toward respectability. Capture private responses before group discussion, then compare both. That same stated versus observed discipline applies when teams learn how to interpret event evaluation results, because praise collected face to face may not predict return attendance.
If the respondent can perform the answer, don't treat the answer as behavior.
3. Question Wording and Order Effects
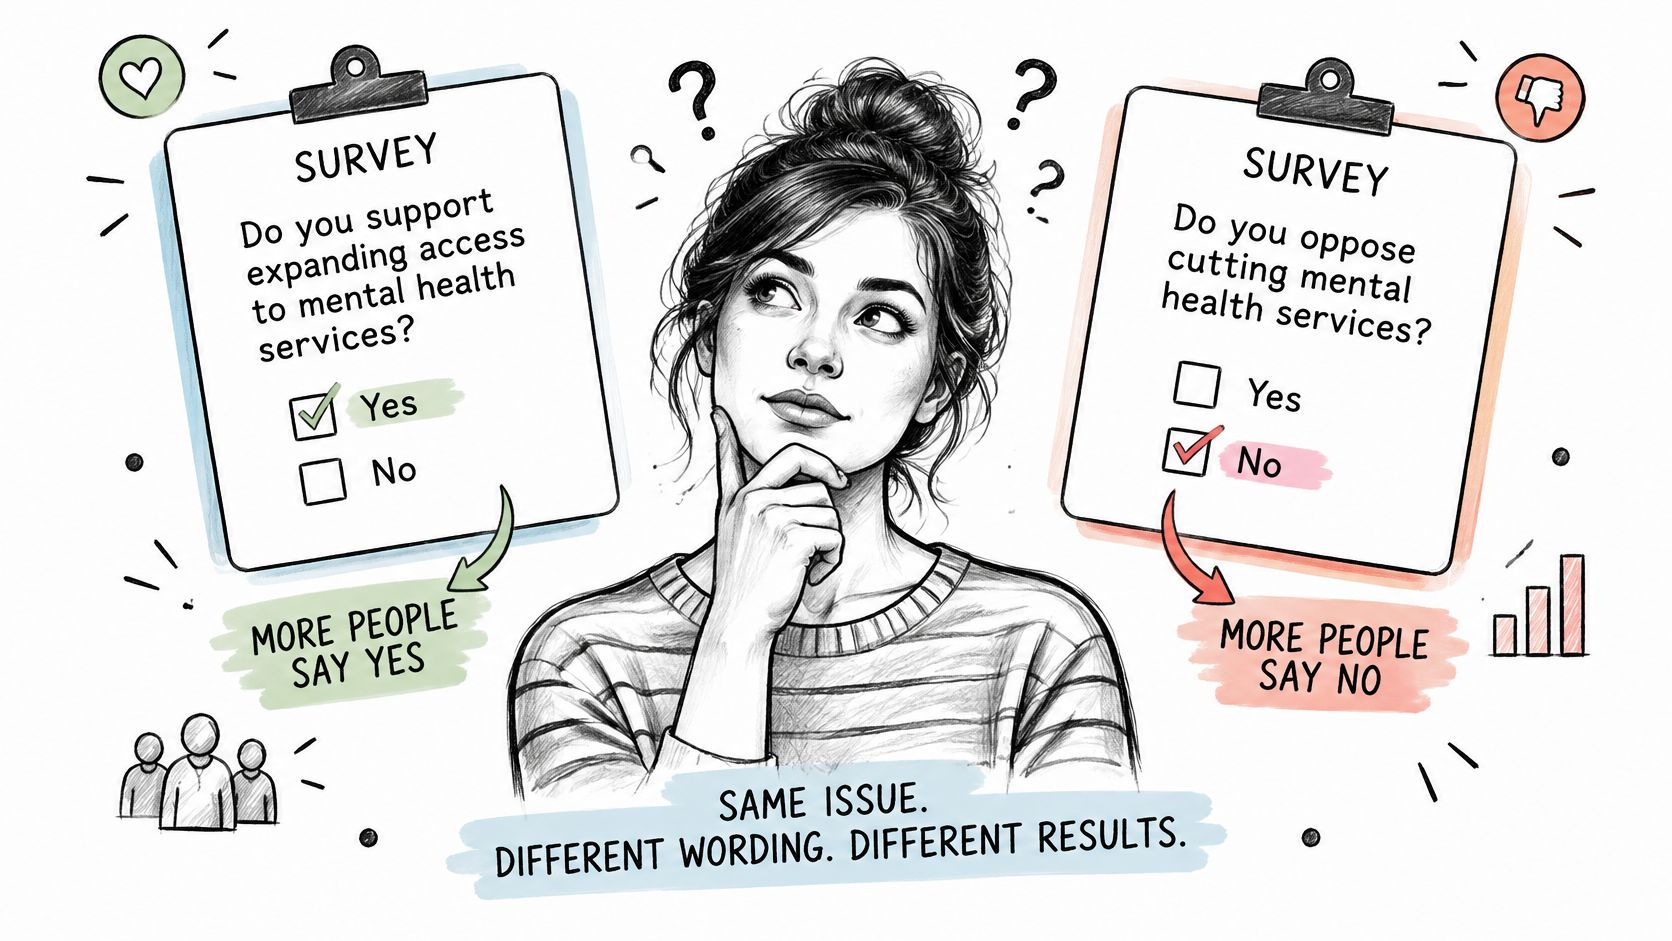
Change one word and you may change the finding. Schuman and Presser's split ballot experiments showed that asking whether a speaker should be forbidden drew different agreement from asking whether the speaker should be not allowed. The policy was the same. The constructed answer wasn't.
Order works the same way. Ask about a billing failure, then ask about pricing satisfaction and you've primed the second answer. Ask about pricing after a favorite feature and you'll likely hear something warmer. Are you measuring pricing, or did you just measure the emotional residue from the previous question?
A prelaunch wording pass
- Read the survey aloud: Flag loaded words, double barreled questions, and assumptions hiding inside otherwise innocent items.
- Randomize question blocks: Log the order you gave each respondent so you can test whether sequence changed the result.
- Split test risky wording: Pilot two versions before a survey influences pricing, positioning, or a major roadmap decision.
Consider a churn question that asks what frustrated users about your slow support. You've already supplied both the problem and its cause. People who churned over missing integrations may select support because that's the path your language opened.
Good question design begins before drafting options, which is why teams often find AI tools for research questions useful for generating alternatives to critique. Generate widely, then edit ruthlessly. The tool can widen your choices, but your team still owns neutrality.
4. Interviewer Effects and Race of Interviewer Bias
Davis and Silver found that Black respondents answered political knowledge and racial attitude questions differently depending on the interviewer's race. Their knowledge and beliefs hadn't changed between conversations. Their reading of the social situation had.
Most product studies create a subtler version. A moderator introduces a prototype with pride, nods at positive comments, and probes criticism a little less warmly. Participants notice. They mirror enthusiasm, soften objections, or try harder to succeed at a task because failure now feels personal.
Would your findings survive a different moderator? That's a test worth running.
Controls that keep moderators from becoming variables
- Use a written script: Standardize introductions, task wording, transitions, and follow up probes across sessions.
- Rotate moderators: Assign people across concepts and participant types instead of letting one person own one idea.
- Review recordings independently: Let a second coder identify leading probes, visible reactions, and missed contradictions.
- Compare findings by moderator: Investigate patterns that appear with only one interviewer before you call them user insight.
These controls strengthen many UX research methods, particularly moderated interviews and concept tests. Keep the person who designed the experience out of the moderator chair for high stakes sessions whenever you can. You want evidence about the product, and the researcher's hope shouldn't become part of the stimulus.
5. Recall Error and Telescoping
Ask a user how many reports they exported last year and you'll get a confident guess disguised as a memory. Neter and Waksberg described telescoping in household expenditure research in 1964: people pull events from outside a reference period into it, distorting estimates for that period. The longer and blurrier the window, the easier time becomes to rearrange.
What's inside the dates you're asking about? Product teams rarely know. A quarterly survey can return usage counts far above logged activity because salient recent uses feel numerous and older episodes collapse together.
The problem isn't limited to frequency. The Census Bureau's SIPP nonsampling error guidance describes the seam phenomenon, where respondents project current circumstances backward and changes appear concentrated between interview waves. It also describes a time in sample effect, where repeated participants learn the questionnaire and may alter answers to hide sensitive information or shorten the interview.
Design for memory as it works
- Shorten the window: Ask about the past seven days when precision matters. Reserve longer windows for rare, memorable events.
- Anchor to a real moment: Tie questions to a release, invoice, onboarding date, holiday, or other event the respondent can place.
- Ask for the latest example: Request one recent episode in open text, then ask what happened before and after it.
- Validate against logs: Compare self reported use with event records before you rank features or retire functionality.
Memory gives you meaning, context, and perceived effort. Logs give you timing and counts. Which source should settle a frequency dispute in your next prioritization meeting?
6. Data Processing and Coding Errors in the Reinhart Rogoff Spreadsheet
A celebrated 2010 working paper by Carmen Reinhart and Kenneth Rogoff linked high government debt with slower economic growth. Thomas Herndon, Michael Ash, and Robert Pollin revisited the work in 2013 and found spreadsheet omissions, inconsistent year ranges, and an unusual weighting approach. Correcting the treatment changed the headline result substantially.
Could one filter be doing that inside your dashboard? Trial accounts disappear from a query, conversion rises, and nobody asks why the denominator shrank. A clean chart can hide a messy transformation.
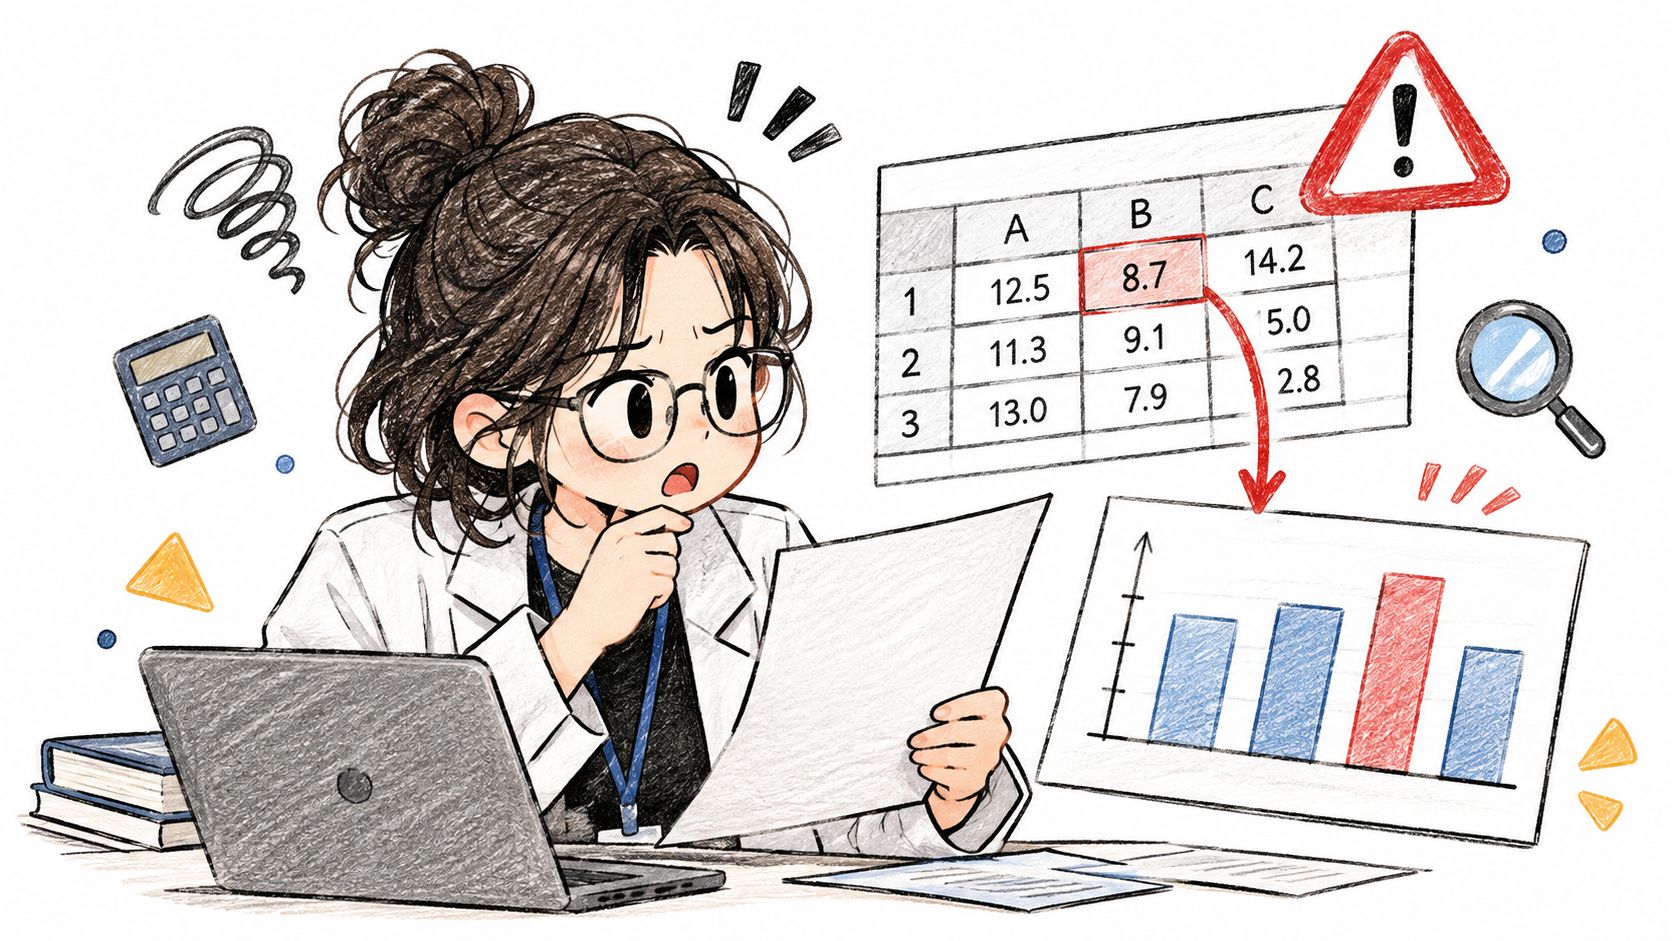
Census ACS processing documentation names data capture, classification, editing, and imputation among its processing risks. Imputed values can keep a dataset usable, yet each replacement may differ from the truth. Miscoded write ins create the same problem when a human answer becomes an analytical category.
Treat that translation layer as part of research quality. Document every exclusion, weighting rule, code, edit, and imputation before analysis begins. Ask a second person to reproduce the headline number from raw data and reconcile totals at each pipeline stage. Sound PM best practices include preserving raw files and versioning definitions, while operational teams also work to reduce errors in operational data entry before bad values reach analysis.
Practical rule: If nobody can rebuild the number from raw data, the number isn't ready for a decision.
7. Instrumentation and Data Source Drift in Google Flu Trends
Google Flu Trends tried to estimate influenza activity from search behavior. At first, the signal looked elegant. Then media attention changed searches, Google changed suggestions, and the measure drifted from illness itself. Lazer and colleagues, writing in Science in 2014, showed that the system overestimated prevalence in several seasons and predicted roughly double the CDC level for the 2012 to 2013 season.
Nobody had to answer untruthfully for this error to grow. The instrument changed its relationship to the thing it claimed to measure. Does that sound familiar in product analytics? A button event stops firing on a mobile layout, a framework migration double counts sessions, or a checkout metric keeps its name after its definition changes.
Keep the instrument honest
- Maintain an event dictionary: Record owners, definitions, versions, platforms, and expected volume ranges for critical events.
- Alert after releases: Flag abrupt event changes and investigate tracking before celebrating or panicking about behavior.
- Reconcile key metrics: Compare analytics against orders, subscriptions, server records, or another independent operational source.
- Annotate definition changes: Mark migrations, filter changes, consent changes, and platform launches directly on reporting timelines.
Instrumentation discipline matters especially when you apply A/B testing best practices, because a broken event can crown a losing variant. Validate assignment, exposure, and outcome events before launch. Keep a known conversion path under automated test after every release.
Zoom out and the economics become obvious. Cheap data feels abundant, so teams collect more while investing less in the systems that make the signal mean something. Volume rewards speed. Maintenance rewards accuracy. Which incentive governs your dashboard today?
Non-sampling error types at a glance
| Item | Where It Enters | Classic Case | Quickest Check |
|---|---|---|---|
| Coverage Error: The 1936 Literary Digest Poll | Sampling frame excludes part of the target population | Literary Digest's 1936 poll predicted a Landon victory | Compare respondent attributes with the full target population |
| Social Desirability Bias: The Bradley Effect | Respondents shape answers to appear acceptable | Tom Bradley's 1982 California governor's race | Compare stated answers with observed behavior |
| Question Wording and Order Effects | Question phrasing or sequence shifts responses | Schuman and Presser's civil liberties wording experiments | Split-test alternative wording or randomize question order |
| Interviewer Effects and Race-of-Interviewer Bias | Interviewer presence, traits, or cues influence answers | Davis and Silver's research on interviewer race | Compare results by moderator using a standardized script |
| Recall Error and Telescoping | Respondents misremember timing or frequency | Neter and Waksberg's household expenditure surveys | Ask about a short, specific period and validate against logs |
| Data Processing and Coding Errors: The Reinhart-Rogoff Spreadsheet | Cleaning, coding, weighting, or analysis | Herndon, Ash, and Pollin's 2013 replication | Reproduce the key result from raw data and verify filters |
| Instrumentation and Data Source Drift: The Google Flu Trends Case | Measurement tools or data sources change over time | Google Flu Trends overestimated flu prevalence | Reconcile metrics with an independent benchmark |
Audit One Study This Week Before You Trust It
Pick the study closest to a real decision. Don't start by recruiting more participants or debating statistical significance. Start by asking who couldn't have been reached, because that question exposes the population your conclusion assumes. List the frame, the channels, the exclusions, and the groups with no practical route into the study.
Step 1. Trace the path from person to headline.
- Compare the target population with the actual contact list
- Mark missing groups, duplicates, outdated records, and silent eligibility rules
- Write down who refused, abandoned, or never saw the invitation
Step 2. Interrogate how each answer was produced.
- Read the questions in their original sequence
- Check moderator scripts, recall windows, incentives, and device coverage
- Separate stated opinion from observed behavior wherever the topic allows performance
Nonresponse deserves its own hard look during that review. The Census Bureau's 2025 nonresponse bias report notes that federal guidance requires a nonresponse bias analysis when a survey's unit response rate falls below 80%. Your product survey doesn't need federal paperwork, but the principle travels well. If frequent users answer and struggling users don't, will more frequent user responses make the estimate truer?
Step 3. Rebuild one important number.
- Start from raw responses or raw events
- Apply each filter, code, weight, and definition in order
- Confirm that record counts and totals reconcile
Then compare one stated finding against a behavioral source. Survey respondents say onboarding is clear, yet activation stalls at permissions. Interviewees call reporting essential, yet exports remain rare. Customers praise support, yet repeat contacts rise. The contradiction isn't an annoyance. It's your next research question.
We position analytics carefully. Figr turns analytics signals into testable UX questions about why users may drop, what they may not understand, which states deserve review, and what evidence is missing. It can't tell exactly why users dropped off, so pair those hypotheses with research, support themes, product context, and team judgment.
The same evidence mindset appears in this training dataset quality evaluation guide, because model teams also learn that volume can't rescue corrupted inputs. In short, audit the mechanism before you scale the measurement.
Write the audit on one page and attach it to the deck. Name the people missing, the question you distrust, the transformation you verified, and the behavioral comparison you ran. That page gives leaders something better than certainty. It gives them a visible basis for judgment.
Frequently Asked Questions About Non-Sampling Errors
What is a non-sampling error?
A non-sampling error is a flaw in how a study reaches people, collects answers, records data, or analyzes results. It can distort a finding even when the sample is large.
How is non-sampling error different from sampling error?
Sampling error comes from studying a sample rather than the entire population and generally decreases as a representative sample grows. Non-sampling error comes from problems such as missing groups, biased questions, inaccurate recall, or faulty data processing. More responses alone won't fix it.
What are common examples of non-sampling errors?
Coverage error, social desirability bias, question wording effects, interviewer effects, recall error, processing mistakes, and instrumentation drift are seven examples. Each enters at a different point between defining the population and reporting the result.
Can you eliminate non-sampling errors entirely?
You can reduce and detect them, but you shouldn't assume a study is error-free. Compare your contact list with the target population, pilot questions, standardize interviews, check self-reports against behavioral records when appropriate, and reproduce key numbers from raw data.
Which non-sampling error should a product team check first?
Start with the error most likely to change the decision. If the survey excludes people who abandoned onboarding, check coverage first. If a dashboard metric changed after a release, check instrumentation and definitions before interpreting the trend.
Bring your survey findings, funnel exports, interview notes, and product constraints into Figr, and we'll help you turn those signals into testable UX questions, mapped flows, and reviewed states before they harden into roadmap decisions. You still bring the judgment about why users behaved as they did, and Figr gives you a stronger, context grounded starting point for the next test.