

User experience is the quality of a person's interaction with a product, judged by whether specified users achieve their goals with effectiveness, efficiency, and satisfaction in a real context of use.
When a polished onboarding flow leaves people unsure what to do next, the consequences reach beyond the screen. Users abandon setup, support handles avoidable questions, and engineers revisit decisions that nobody tested before release.
Treating UX as evidence gives product teams a better way to decide what to build and fix. With clear principles, task-based research, and measurable acceptance criteria, you can identify friction, weigh tradeoffs, and run a focused review of a real product flow.
What User Experience Really Means
Imagine a software team launching a polished dashboard. The charts look sharp, onboarding matches the design system, and stakeholders approve the release. Yet new users stop before connecting their data, and nobody can explain why.
In this hypothetical scenario, the dashboard isn't the user's goal. The user wants to answer a business question, such as which accounts need attention. Connecting a data source is only a prerequisite, and the team has made that prerequisite harder to understand than the dashboard itself.
UX user experience work starts with that gap between the feature delivered and the job completed. The practical unit of analysis is a person attempting a task under specific conditions.
Start with the job, not the screen
A useful problem statement names the user, their intended outcome, and the obstacle. “Improve onboarding” leaves too much open. “Help account managers connect their customer data without requesting administrator help” gives researchers, designers, and engineers something concrete to investigate.
That distinction changes what the team examines:
- User capability. Does the person have the knowledge, permissions, and assistive technology needed to proceed?
- Task context. Are they working on a phone, switching between applications, or waiting for someone else's approval?
- Observable success. Can they finish independently, recognize completion, and recover if something goes wrong?
The dashboard team might discover that users don't understand which credentials they need. A different chart layout wouldn't address that problem. Clear prerequisites, permission guidance, and a useful recovery path might.
Decision rule: Before approving a design change, name the user behavior you expect it to change.
This is what I mean by treating UX as an operating discipline. Teams agree on what counts as evidence, use it to choose an intervention, and check whether that intervention helped.
In short, a UX decision should connect a user need to a product mechanism and an observable result. Without that connection, teams can spend a release improving the wrong thing.
Where UX Came From and How It Differs From UI
UX has a measurable foundation in usability standards. The academic account of ISO's usability framework describes how ISO 9241-11, first published in 1998, defined usability through effectiveness, efficiency, and satisfaction for specified users, goals, and contexts; its 2018 revision broadened the framework beyond office software to interactive systems, products, built environments, and services.
The same account explains that ISO 9241-210 introduced user experience explicitly in 2010, extending attention to experience before, during, and after interaction. The important implication is that usability is an outcome of use, not a permanent quality baked into a product. A workflow can suit an experienced administrator and still fail a new employee using a keyboard.
UX vs UI at a glance
User interface design, or UI, concerns the screens and controls through which people interact. User experience, or UX, considers whether those interactions support the broader job.
The distinction helps assign questions, not build departmental walls.
| Dimension | UX | UI |
|---|---|---|
| Focus | The whole journey, before, during, and after use | The screens, controls, and visual layer |
| Core question | Can people achieve their goal with little friction? | Does the interface look, feel, and respond well? |
| Main inputs | User research, analytics, usability tests, support data | Design systems, typography, color, interaction patterns |
| Success measures | Task completion, error rate, time on task, satisfaction | Visual consistency, component quality, responsiveness |
| Typical failure | Clear screens inside a confusing flow | A beautiful control users never find |
| Owned by | Cross-functional: research, design, product, engineering | Designers and engineers implementing the interface |
Consider an invitation flow for a business application. UI work determines how the invitation form presents roles, validates an email address, and confirms submission. UX work also examines whether the recipient understands the invitation, has permission to accept it, and reaches the correct workspace.
A local interface improvement can leave the wider journey broken. Making the send button more visible won't help if recipients arrive in an unfamiliar account with no explanation.
The reverse matters too. A sensible invitation policy can fail when labels obscure permission differences or an error message doesn't explain recovery. Product teams need both kinds of work, with clear responsibility at the handoff.
Use UX and UI roles for product teams to clarify responsibilities when a discussion mixes journey logic with interface execution. Ask who owns the intended outcome, who specifies interaction behavior, and who verifies the implemented result.
Great UI cannot rescue a broken flow, but weak UI can ruin a sound one.
The Core Principles Behind Every Experience
Principles become useful when a PM can turn them into a check. The following set is a practical review structure, not a claim that every product needs identical interactions.
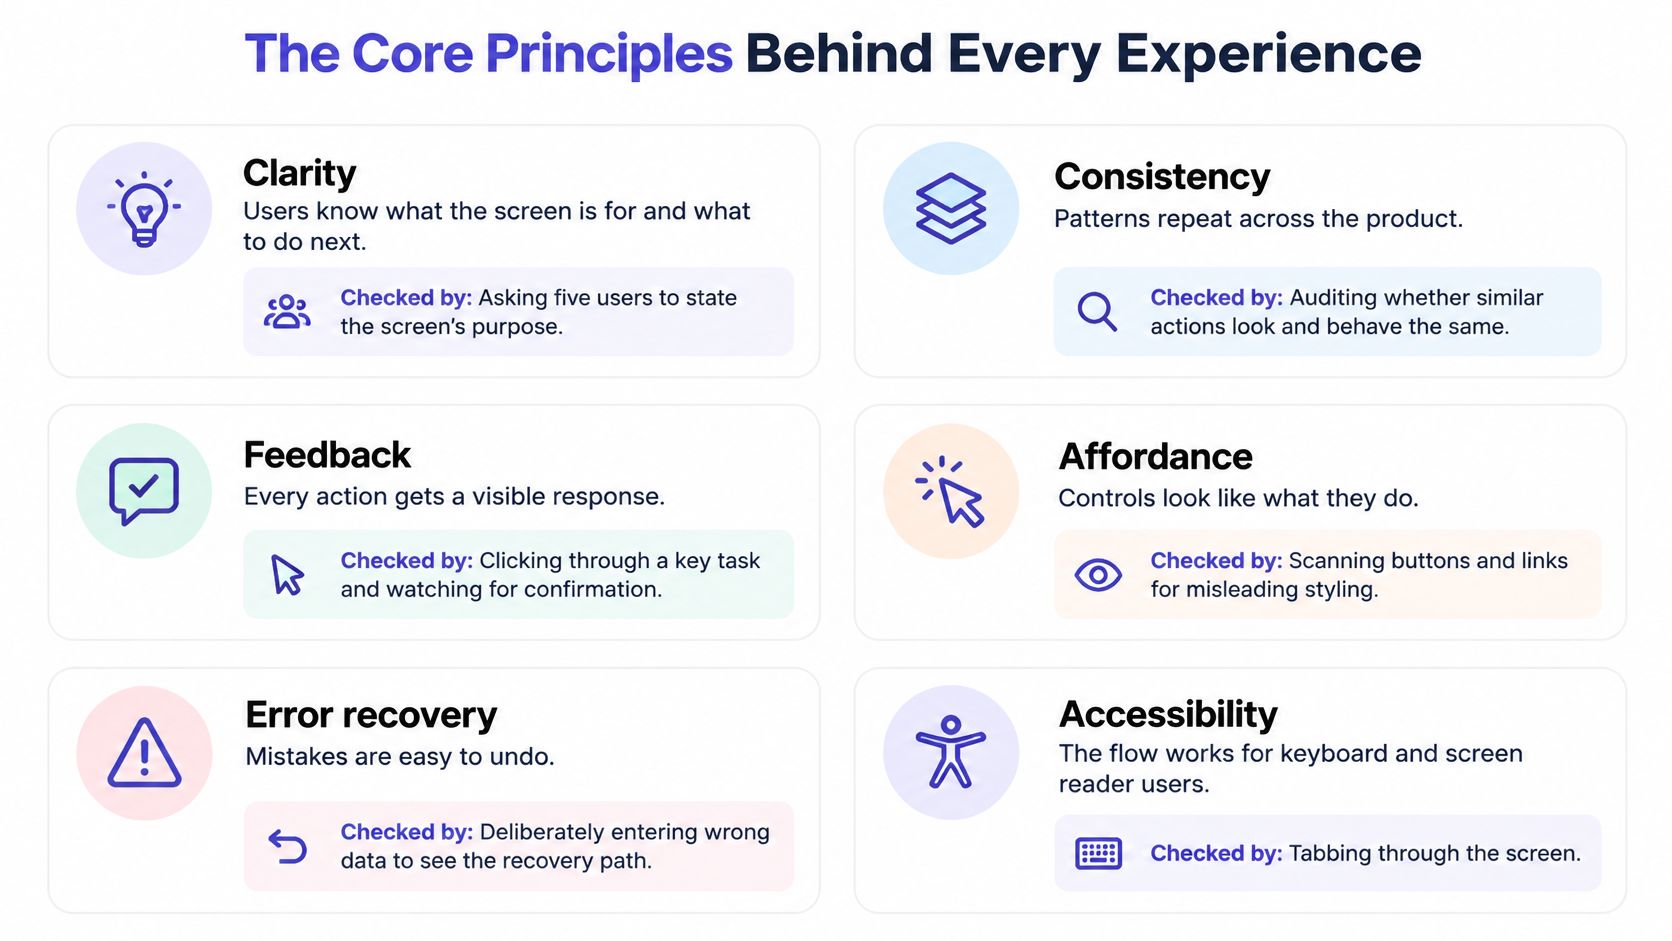
Turn principles into acceptance criteria
Clarity means users understand the screen's purpose and their next action.
As a lightweight check, ask five intended users what they'd do first.
Record their interpretation before explaining the interface; disagreement gives you a specific label, hierarchy, or sequencing problem to investigate.Feedback means an action produces a perceivable response.
Inspect loading, success, and failure behavior for each important control.
For a report export, distinguish request received, processing, ready, and failed rather than leaving users to guess whether another click is necessary.Error tolerance means preventing avoidable mistakes and supporting recovery.
Deliberately submit invalid information and interrupt a task.
Check whether the product preserves valid work, identifies the problem, and gives users a safe next action.Consistency means the same pattern carries the same meaning across the product.
Compare navigation, save behavior, and destructive actions across related screens.
Investigate exceptions rather than enforcing sameness blindly; different consequences may justify different interactions.Accessibility means people can perceive information and operate the interface using different capabilities and technologies.
Test keyboard navigation, meaningful labels, and rendered component states.
Don't communicate selection, errors, or completion through color alone.Efficiency means reducing unnecessary effort in tasks people repeat.
Count actions in the most important recurring task, then inspect each action's purpose.
Remove redundant work, but retain confirmations where an accidental action would be difficult to reverse.
Make accessibility enforceable
WCAG 2.2 sets minimum text contrast at 4.5:1 for normal text and 3:1 for large text, subject to its exceptions; its enhanced focus-appearance criterion specifies an area equivalent to a 2 CSS-pixel perimeter and a 3:1 contrast change between focused and unfocused states. Treat the focus criterion as a precise design target while distinguishing it from baseline conformance requirements.
For functional non-text information, the WCAG explanation of non-text contrast generally requires 3:1 contrast against adjacent colors. Check necessary boundaries, icons, and state indicators in their actual surroundings, not just against a palette swatch.
Encode these rules in design tokens and component checks, then verify the rendered product. A passing token doesn't prove that a clipped focus ring or an obscured control works.
The implementation gap is visible in Applause's 2025 accessibility survey: among 1,570 respondents, 83.9% called accessibility important or a top priority, but only 35.8% considered it during coding, 23.4% used no monitoring metrics, and 67.8% lacked sufficient internal expertise or resources for ongoing testing.
The management conclusion is straightforward: assign owners, acceptance criteria, and regression checks. Agreement with a principle isn't evidence that the product follows it.
How Product Teams Apply UX From Discovery to Launch
Run UX work around decisions and artifacts. Each activity should reduce a specific uncertainty before the team makes a more expensive commitment.
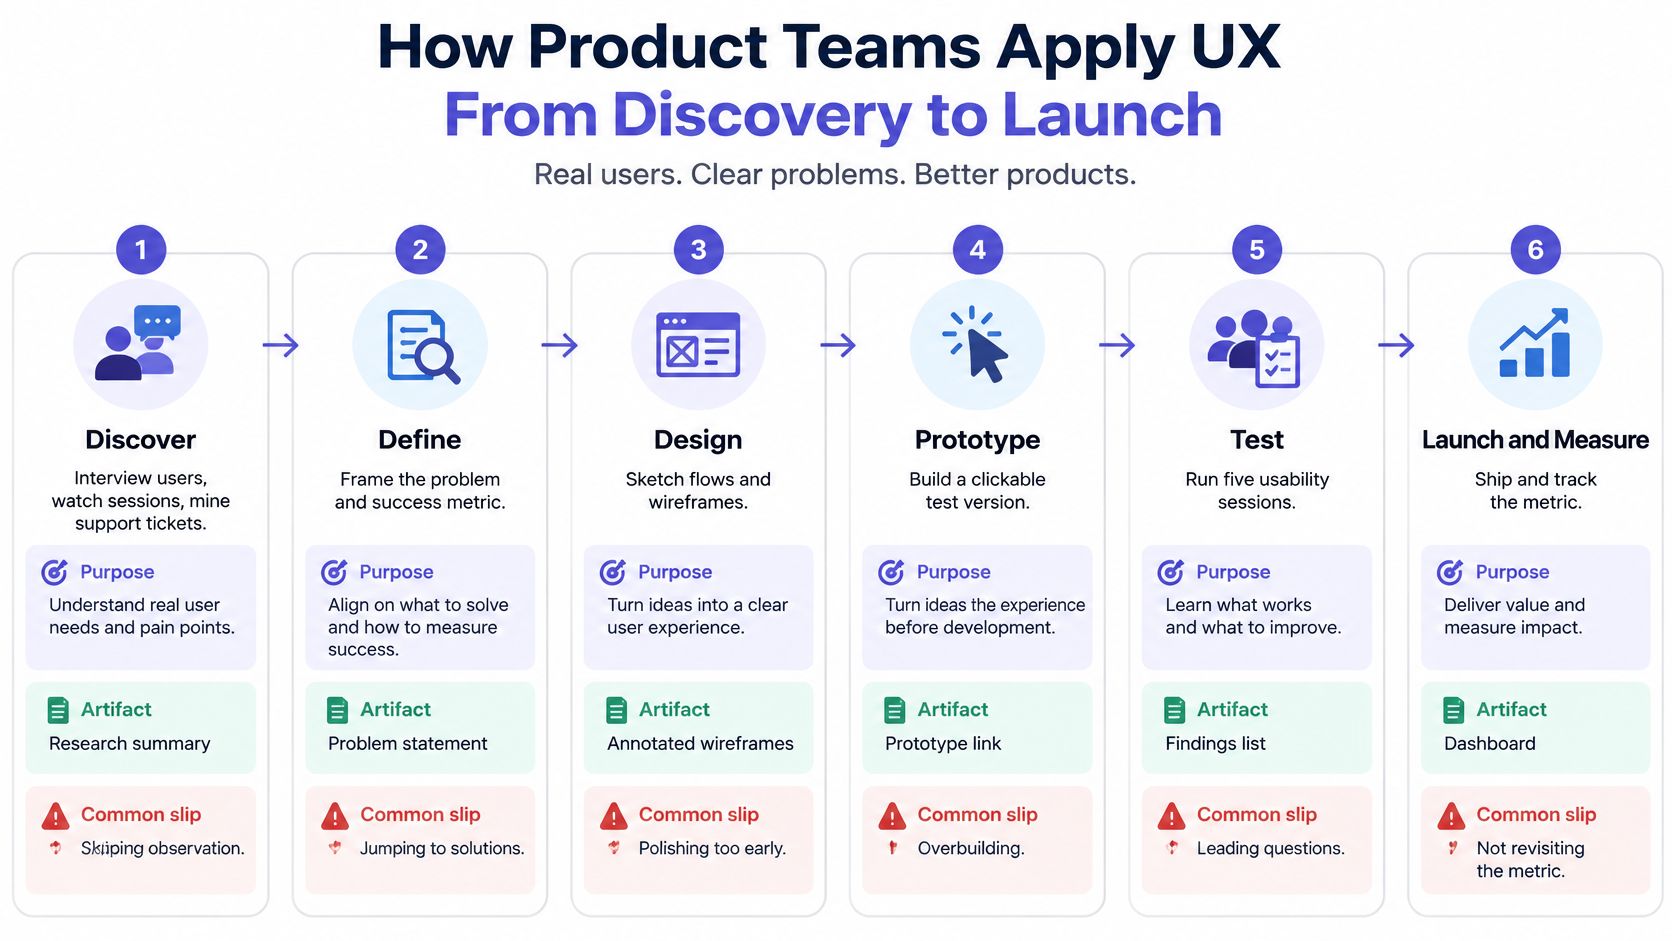
Use a decision-led workflow
Step 1. Discover the problem before committing to the solution.
Interview users, observe tasks, and inspect support themes alongside funnel behavior.
Produce a ranked problem list; the common slip is asking researchers to validate a roadmap that's already fixed.Step 2. Define the job and success conditions.
Turn findings into jobs-to-be-done, evidence-based user groups, and a measurable problem statement.
Produce success criteria before design; avoid promoting stakeholder preferences into requirements without supporting evidence.Step 3. Design the flow and its exceptions.
Map empty, loading, error, offline, permission, and success states, then prototype with design-system tokens.
Produce an annotated flow; the common slip is polishing the happy path while leaving consequential branches unspecified.Step 4. Test realistic tasks without coaching.
For an initial diagnostic round, a practical starting plan is about five participants, adjusted for distinct user groups and risks.
Produce observed completion and failure points; don't mistake praise for the prototype's appearance for evidence of usability.Step 5. Build and verify the interaction contract.
Translate state behavior, keyboard paths, and accessibility requirements into acceptance criteria.
Produce component and flow-level QA evidence; a final visual review can't replace testing behavior in the browser.Step 6. Launch with a comparison plan.
Compare completion, errors, effort, and conversion with the baseline using consistent definitions.
Produce a decision log stating what improved, what remains uncertain, and whether to retain, revise, or reverse the change.
The UX design workflow steps provide a useful reference when assigning artifacts and responsibilities. Keep the workflow proportional to the decision: changing a label and redesigning access permissions don't need identical research plans.
Choose the method that answers the uncertainty
| Method | Best for | Typical sample | Output |
|---|---|---|---|
| User interviews | Discovering goals and context | Recruit across relevant roles until key questions are answered | Problem themes and jobs-to-be-done |
| Moderated usability test | Finding where tasks fail | About five per initial diagnostic round, adjusted for coverage | Task completion and failure points |
| Unmoderated usability test | Testing task flows at scale | Set by task segments and required statistical precision | Task success and time on task |
| Product analytics funnel | Locating drop-off steps | All users in the defined flow | Step-level conversion |
| Session replay review | Spotting hesitation and retries | Sampled sessions across outcomes and devices | Tagged friction moments |
| Support ticket analysis | Finding confusion after launch | All relevant tickets in the period | Ranked friction themes |
| Accessibility conformance check | Verifying WCAG thresholds | Every interactive component and relevant flow | Pass or fail per criterion |
| Satisfaction survey | Measuring perceived experience | Eligible respondents with response coverage reported | SUS, CSAT, or NPS scores |
Discovery should also challenge whether a step needs to exist. For a retail loyalty journey, BonusQR loyalty without app downloads offers a concrete product approach to examine when evaluating whether installation belongs in the customer journey. Validate that choice against the capabilities customers need.
Let AI assist without substituting for evidence
Maze's 2025 research report found that 58% of respondents used AI, primarily for analysis at 74% and transcription at 58%, while 58% reported improved efficiency and 57% reported faster turnaround. Those self-reported benefits don't establish that faster synthesis produces better product decisions.
Use AI to draft tags, organize transcripts, and identify candidate patterns. Check recommendations against source material, remove unsupported findings, and obtain appropriate consent before processing participant information.
Human critique still needs goals and context that a design artifact alone can't reliably supply, a limitation also raised in Nielsen Norman Group's practitioner findings. Keep direct user observation and human judgment central when the decision involves accessibility, emotional stakes, or unfamiliar cultural contexts.
How to Measure Whether UX Is Working
Measure the goal, not the opinion. Choose the primary outcome before design begins, then add guardrails that would reveal an unacceptable tradeoff.
For an invitation redesign, acceptance might be the primary outcome. Wrong-role assignments and support contacts could be guardrails. A higher acceptance rate wouldn't justify granting excessive permissions.
UX metrics that matter
| Metric | Question it answers | Where to get it | Common trap |
|---|---|---|---|
| Task completion rate | Did users finish the job? | Moderated tests, analytics funnels | Averaging across different user types |
| Time on task | How much effort does the flow demand? | Task-based tests, session analytics | Rewarding speed while ignoring errors |
| Error rate | Where do people stumble or retry? | QA logs, usability sessions | Counting crashes but not mis-taps and backtracks |
| Funnel conversion | Where do users drop off? | Product analytics | Optimizing one step without checking the next |
| Support ticket volume | What does confusion cost after launch? | Help desk tags and themes | Ignoring users who silently give up |
| Satisfaction score, including SUS, CSAT, or NPS | How do users judge or describe their relationship with the experience? | In-product surveys | Treating survey scores as a substitute for behavior |
SUS is the System Usability Scale, CSAT measures customer satisfaction, and NPS measures willingness to recommend. They're not interchangeable: select an instrument that matches the question rather than combining them into a generic UX score.
Define the denominator as carefully as the metric. Completion among people who started a task answers a different question from completion among everyone eligible to start it.
Interpret published gains within their limits
A Nielsen Norman Group review published in 2003 examined 42 paired before-and-after measurements and found an average 135% improvement in measured usability-related outcomes after excluding five unusually large outliers; it also estimated that spending approximately 10% of a project budget on usability could double usability.
That's historical evidence of potential value, not a forecast for your next release. The budget estimate isn't conventional financial ROI: money spent and gains in efficiency, use, errors, or satisfaction aren't the same unit.
Baymard's checkout usability benchmark classifies 65% of sites as mediocre or worse, with only 2% rated good, and estimates a potential 35.26% conversion-rate increase for the average large e-commerce site from addressing documented, solvable checkout problems. That estimate describes an opportunity within its research context, not a promised lift for every checkout.
A benchmark can justify investigating a problem. Your own comparison must justify claiming a result.
Before attributing improvement to UX, check changes in acquisition channels, devices, customer mix, pricing, and seasonality. Where feasible, use a controlled experiment; otherwise, describe the limits of a before-and-after comparison.
Review common UX measurement mistakes when setting up the dashboard. Pair quantitative signals with moderated observation so you can distinguish a genuine interaction problem from a preference dispute.
A Checkout Redesign From Diagnosis to Result
A PM opens Monday's checkout report against Baymard's checkout study, which reports a 68.8% cart-abandonment benchmark, draws on 272 moderated usability-test sessions, benchmarking of more than 850 checkout steps, and nine quantitative studies involving 11,777 participants, describes an ideal checkout as 12 form elements (seven fields, two checkboxes, two drop-downs, and one radio-button interface), and finds that an unexplained required phone number can cause 14% of users to abandon checkout while 22% have abandoned because of checkout complexity.
On an illustrative 10,000 carts, 68.8% is 6,880 abandoned carts (10,000 × 0.688).
That figure is scale, not cause. It does not say which customers were ready to buy, or which interaction stopped the purchase.
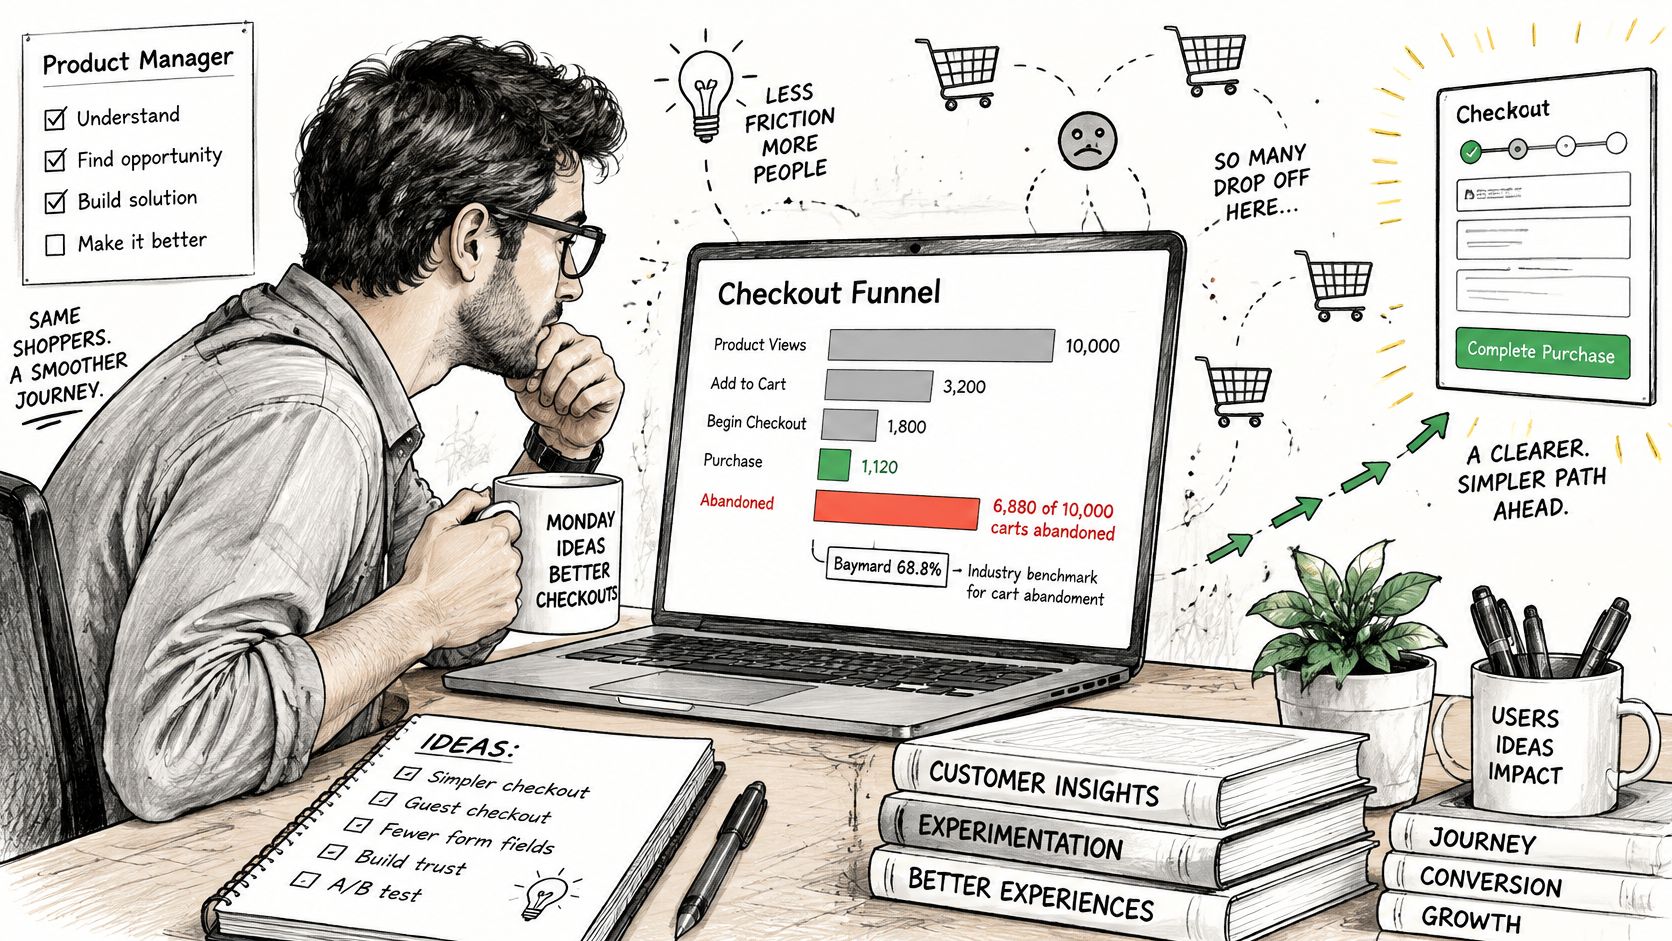
A hypothetical diagnosis and intervention
A hypothetical mid-size retailer runs checkout with 16 fields. Moderated sessions show hesitation at an unexplained phone-number request and at forced account creation.
Fulfillment, fraud, and support owners state what each field enables, whether the data is already on file, and what breaks if the field goes away. Only then does anyone cut an input.
The 12-element reference is a mix of controls, not twelve text fields, and it is not a specification for every business model. Baymard's abandonment findings mark friction worth testing here. They do not, on their own, explain every lost order at this retailer.
Explain the phone-number request where users encounter it.
In the redesign, the team states the delivery purpose beside the field.
The requirement stays only where fulfillment needs the number.Defer account creation until after purchase.
Shoppers get a guest path, plus a plain statement of why an account helps later.
Order lookup and support still work without registration.Simplify only after confirming operational needs.
Redundant inputs go. Valid entries survive an error.
Before implementation, engineers browse Figr's field validation advice to tighten validation and recovery.
An illustrative result and a boundary condition
In this scenario, completion rises from 31% to 38% over four weeks, and checkout-related support tickets fall by about a third.
The PM still checks payment failures, fraud, delivery exceptions, and shifts in visitor mix before treating that movement as a UX result. A before-and-after gap can move for reasons that have nothing to do with the form.
A contrasting hypothetical subscription-box business drops address confirmation and then sees more misdeliveries and fraud-related cost. The sound decision is to restore or redesign that safeguard, even if checkout gets longer.
Remove unjustified effort. Keep protection that still earns its place.
UX FAQs for Product Teams
Is UX the same as customer experience?
No. UX focuses on a person's experience with a product or system, while customer experience covers their wider relationship with the company. Billing, marketing, sales, and support can all belong to that wider relationship. The boundaries overlap, so assign ownership around the customer's task rather than arguing about which department owns a touchpoint.
When should UX work start?
Start during discovery, before committing to implementation. Write the intended job, examine the current workaround, and test the riskiest assumption before polishing screens. Paper sketches and prototypes let teams revise assumptions without changing production behavior. For an existing product, begin with a consequential flow rather than waiting for a full redesign.
Do small teams need a dedicated UX researcher?
Not always, but someone must own research quality and the resulting decision. A PM can run a bounded moderated study using a written script, neutral prompts, and explicit success criteria. Seek specialist help when recruitment, sensitive topics, accessibility needs, or conflicting evidence exceed the team's skills. Ownership matters more than a job title.
Usability testing or analytics, which comes first?
For an instrumented existing product, start with analytics to select the flow, then use usability testing to investigate behavior. For a new product without meaningful usage, begin with observation and prototype tasks. Don't install analytics as a substitute for understanding the job, and don't treat a diagnostic usability sample as a population-level conversion estimate.
Is UX only the designer's job?
No. Give the PM responsibility for the outcome, engineers responsibility for implemented states and accessible behavior, and support responsibility for reporting recurring friction. Designers shape interactions and help synthesize evidence. Leadership must allow teams to fix underlying causes, even when that means revisiting a shipped feature instead of adding another one.
Shared responsibility works only when each decision still has a named owner.
Run a One-Week UX Review
Choose a bounded flow with a clear beginning and end, such as inviting a colleague, exporting a report, or changing a subscription. Avoid reviewing the whole application: you need enough scope to reveal a meaningful problem and enough restraint to act on it.
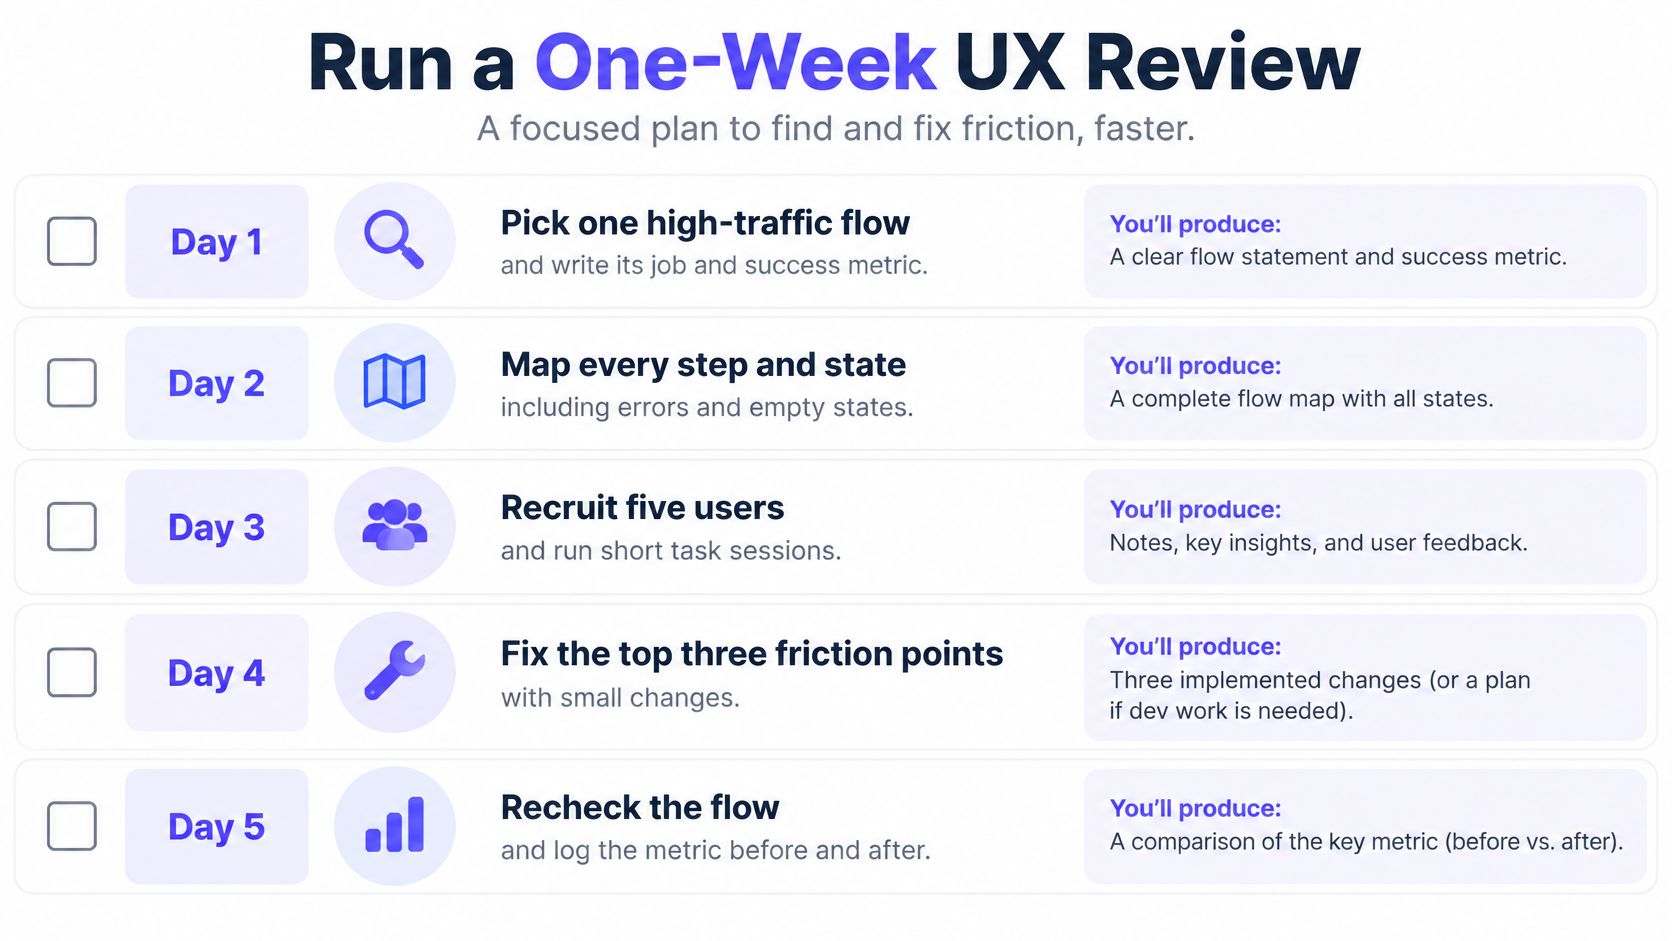
Make the review produce a decision
Day 1. Pick the flow and define success.
Choose a high-traffic or high-consequence task and write its user job.
Record the baseline, metric definition, and guardrails in a short review document.Day 2. Map the implemented journey.
Capture each step and its empty, loading, error, permission, and success states.
Mark missing decisions and handoffs, not just missing screens.Day 3. Observe people attempting the task.
As a practical review plan, recruit five relevant users or inspect appropriately consented session replays.
Tag hesitation, retries, abandonment, and requests for help without assuming what caused them.Day 4. Verify access and prioritize the issue.
Check contrast, visible focus, keyboard paths, and interactive states in the browser.
Rank findings by task impact and use the essential UX audit checks to structure the review.Day 5. Ship a bounded fix or a testable proposal.
Choose a change small enough to verify safely, with a rollback path where needed.
Write the expected metric movement and schedule the comparison before calling the review complete.
As products and teams grow, UX becomes a coordination problem. A missing state can force designers, engineers, QA, and support to resolve the same ambiguity separately. Shared acceptance criteria reduce that repeated interpretation and keep local decisions aligned with the user's task.
Figr can accelerate this review by analyzing existing screens, asking clarifying questions, mapping flows and states, identifying edge cases, checking accessibility, and explaining tradeoffs. It lets teams review existing UX and test flows before launch, then produce handoff artifacts including UX reviews, PRDs, user flows, test scenarios, acceptance criteria, and high-fidelity prototypes. Treat those outputs as material to verify, not proof that users will succeed.
Choose the flow today. Record the baseline, name the owner, and let next sprint's dashboard confirm whether the fix moved the number without breaking a guardrail.
Bring an existing flow to Figr to review UX decisions, uncover missing states, and create testable handoff artifacts before implementation. Start with the task your users struggle to finish, and use the review to choose a specific change you can measure.