

A product manager pulls the quarter's numbers and finds that 3.1% of trial starts became paying accounts. A benchmark post open in the next tab says the median free-trial conversion rate for SaaS is 21%. Same words, same product category, and two figures that share nothing except a percentage sign. One summary of 200 software products puts free-trial conversion anywhere from below 2.5% to above 25% (Mystery Demo's roundup of trial conversion statistics), which makes the spread inside the category wider than the gap between any two categories.
That spread has a cost. Teams read the high number, shorten the trial, add a card wall, rebuild the pricing page, then report a conversion lift that came from a smaller and more committed pool of signups rather than from a better product. The dashboard moves. The business doesn't.
Reading SaaS conversion rate benchmarks is a bookkeeping exercise before it's an analytics one. Every figure below gets read with its numerator, its denominator and its measurement window attached, and the competing models get compared on one common currency: paying customers per 1,000 visitors. By the end you'll have a cohort baseline of your own and a target built from it, not borrowed from a table.
Core SaaS Conversion Rate Benchmarks at a Glance
Landing-page rates and signup-to-paid rates describe different parts of a SaaS funnel. The table pairs each benchmark with its reported basis so you can identify which figure matches the event your team measures.
| Metric | Benchmark | Basis |
|---|---|---|
| All-industry landing page conversion | 6.6% median | Unbounce 2024, 41,000+ landing pages |
| SaaS landing page conversion | 3.8% median | Unbounce 2024, same dataset |
| SaaS landing page top quartile | 11.6% or higher | Unbounce 2024, same dataset |
| Visitor-to-lead across a B2B SaaS website | About 1.1% | First Page Sage client data, Jan 2022 to Aug 2025 |
| Free-to-paid conversion | 8% median | ChartMogul SaaS Conversion Report |
Unbounce's 2024 Conversion Benchmark Report covers more than 41,000 landing pages and 57 million conversions collected between July 2023 and July 2024. Its all-industry median of 6.6% exceeds the SaaS median of 3.8% by nearly three points. The SaaS top quartile begins at 11.6%. Traffic source also corresponds with a wide range of results: the report gives SaaS landing pages an email-traffic median of 16.9%, compared with 4.1% for paid search, 2.9% for paid social, and 0.3% for display advertising.
Two medians that look like a contradiction
ChartMogul reports an 8% median for free-to-paid conversion. That figure should not be compared directly with trial-to-paid rates: the populations and conversion paths differ. ChartMogul also notes that very few products sit at exactly 8%, making the median a reference point rather than a pass-fail threshold.
The freemium and trial-to-paid figures sometimes shown alongside these benchmarks are omitted here because their cited sources do not clearly support those specific rates.
Working rule: State the denominator with the rate. “Free-to-paid, 90-day window, all signups” is more useful than “SaaS conversion rate.”
Match the benchmark to the event your dashboard counts. A landing-page rate describes visitors taking an action; a free-to-paid rate describes signups becoming customers. Neither alone gives the number of paying customers per 1,000 visitors, which depends on the full path between those events.
Funnel Stages and the Denominator Each One Uses
A visitor-to-signup rate and a signup-to-paid rate can be multiplied. They can't be averaged, swapped or compared side by side, which is why a single "conversion rate" line on a dashboard hides the argument the team needs to have.
| Transition | Event counted | Denominator |
|---|---|---|
| Visitor to lead | Form submit or CTA click | Unique visitors |
| Visitor to signup | Account created | Unique visitors |
| Signup to paid | First paid subscription | Signups |
| Trial to paid | Paid conversion at trial end | Started trials |
| Activation to paid | Paid conversion after key workflow | Activated accounts |
| MQL to SQL | Sales accepts the lead | Marketing qualified leads |
| Close rate | Deal won | Sales opportunities |
An illustration, not a benchmark. Say a product converts 3% of visitors to signups and 30% of signups to paid. Multiply them and you get 0.9%, or 0.9 paying customers for every 100 visitors. Now apply the same 30% to the narrower group of signups who finished an activation workflow, and the result describes a different company even though the multiplier never changed. The rate stayed put while the base moved underneath it.
Most stuck teams are treating an activation problem as a traffic problem. The basic gist is this: the transition that's failing decides which fix is worth funding, and funnel fixes for product teams start with locating that transition rather than redesigning the page above it.
Before reading another benchmark, write three things on one line: numerator, denominator, window. If a published figure can't be matched to that line, it isn't your benchmark, and matching it will cost you a quarter.
Paying Customers per 1,000 Visitors and When Freemium Wins
Freemium gets called a broken funnel more often than any other model. The complaint usually runs: 2% to 3% of free users pay, so the model must be leaking revenue. That reading stops one stage early. Put all three monetization models on the same base, 1,000 visitors, and the picture changes.
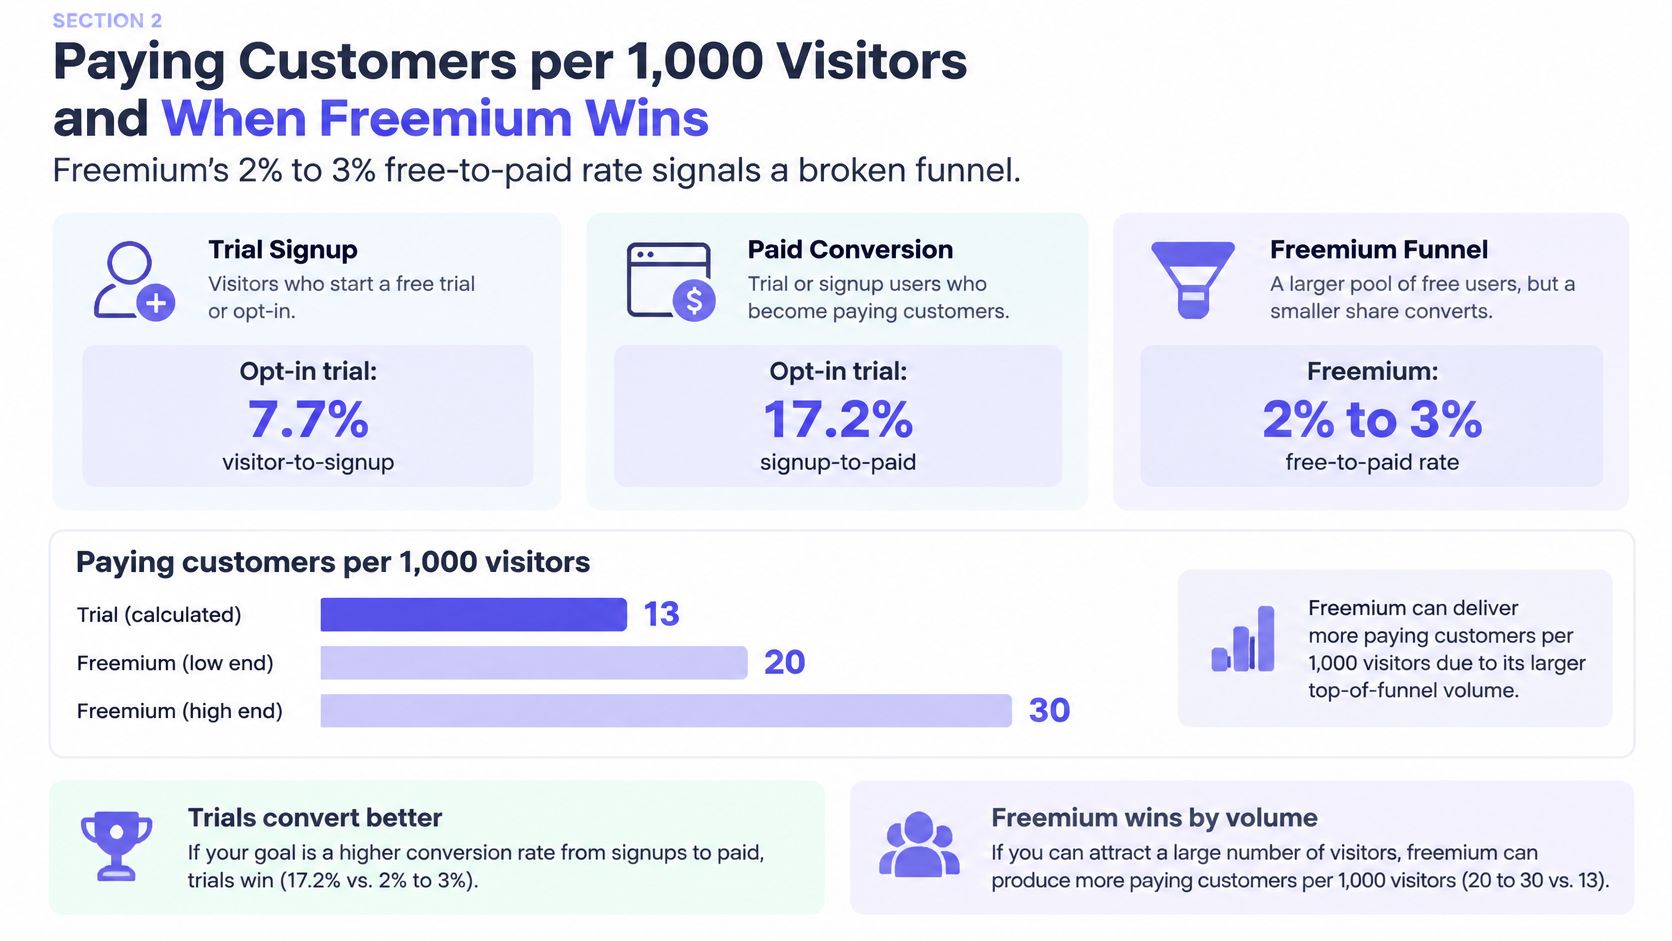
In one benchmark dataset, opt-in free trials converted 7.7% of visitors into signups and 17.2% of signups into paying customers, which works out to roughly 13.2 paying customers per 1,000 visitors. Opt-out trials requiring payment details produced far fewer signups at 2.7%, then converted 49.3% of them, landing at about 13.3 paying customers per 1,000 visitors. Freemium pulled the highest signup rate of the three, 12.9% to 14.2%, and the lowest signup-to-paid rate, 3.4% to 3.7%, for a yield of 4.4 to 5.3 customers (First Page Sage's conversion benchmark compilation).
| Model | Visitor to signup | Signup to paid | Paying customers per 1,000 visitors |
|---|---|---|---|
| Opt-in trial, no card required | 7.7% | 17.2% | About 13.2 |
| Opt-out trial, card required | 2.7% | 49.3% | About 13.3 |
| Freemium | 12.9% to 14.2% | 3.4% to 3.7% | 4.4 to 5.3 |
The two trial designs finish in the same place. A card-required trial converts eighteen times the share of signups and produces almost exactly the same number of customers per 1,000 visitors. Anyone optimizing signup volume would call one of those models a triumph and the other a disaster. The yield says they're tied.
The stage rate rewards whichever model filters hardest before the denominator is set. Revenue rewards whichever model ends with the most customers. Those are different scoreboards, and only one of them pays salaries.
When freemium wins anyway
Imagine a product leader defending freemium to a board that has seen the 2.6% to 2.8% number. The defense isn't rhetorical. Freemium users often stay longer, add seats, refer peers, and arrive through cheaper channels, and each of those changes the economics without touching the conversion rate.
Run the arithmetic. At 4.4 paying customers per 1,000 visitors against 13.2, freemium has to earn roughly three times as much per paying customer, or keep each one three times as long, to match a trial model on revenue per visitor. That's a demanding bar, and it's a checkable one. A team that can't show the three-times case in retention, expansion or acquisition cost is running freemium on hope.
The boundary shows up in two places. If free users churn inside two months, expansion never arrives and the trial model wins on arithmetic alone. If free users generate support tickets that outrun their subscription value, the model is subsidizing the wrong population.
The dataset behind the table reports conversion only. It carries no retention, revenue per account or acquisition cost, so the yield is where the analysis starts, not where it ends. In short, the honest comparison runs yield against yield inside one go-to-market motion.
Comparison rule: only compare your rate with a benchmark built on the same motion, product-led, land-and-expand or sales-assisted. A freemium figure is not a verdict on a sales-assisted trial.
Segment Differences in B2B, B2C and Trial Design
Two benchmarks can both be accurate and still set targets that are impossible or embarrassingly easy. The B2B and B2C split shows why. From Q1 2024 through Q1 2025, ChartMogul reported that B2B SaaS trials converted at 2.5% within seven days, against 16% for B2C SaaS trials (Cirrus Insight's sales conversion benchmark roundup).
The window does most of that work. A seven-day measurement rewards products a single person can buy on a card. A B2B purchase usually passes through a security review, a budget owner and at least one person whose calendar isn't yours, so a seven-day cut catches only the rare fast close and ignores the deal that lands on day nineteen. The comparison is real. It just isn't a ranking.
Card policy shifts the numbers again inside the same segment. A 2025 dataset covering 86 SaaS companies reported 18.2% trial-to-paid conversion for trials without a card and 48.8% for card-required trials (1Capture's free trial conversion benchmark review). The card raises the measured rate because it changes who enters the denominator, not because the product improved.
Match the row before you match the number.
A B2B team running a 14-day trial and seeing 2.5% inside seven days is not underperforming. It's measuring a slow, multi-stakeholder purchase with a stopwatch built for consumer checkout. Company size rarely appears as a published cut, so build that split from your own cohorts rather than hunting for a figure.
Where the B2B and B2C paths diverge is the first session, and Figr's onboarding flow guide covers the routing decisions that determine whether a new account reaches value inside whatever window you set.
How Far to Trust These Numbers and Their Sources
1.1% is the most quoted B2B SaaS website conversion figure, but it is only useful when its definition is clear. First Page Sage data covers client performance from January 2022 through August 2025, and Clear Digital reproduces the figure in its user engagement metrics guide. It describes website conversion broadly, not a trial start, demo request, or paid customer. Treat it as directional.
Four checks help distinguish a useful benchmark from a decorative one:
- Collection window. A figure gathered across more than three years, January 2022 to August 2025 in this case, can span pricing changes, redesigns, and shifts in paid spend. Check when the data was collected, not just when the article appeared.
- Sample composition. Data from one agency reflects its clients, including their price points, channels, and buyers. It is evidence, not a census.
- Denominator hygiene. Whether repeat visitors count once or multiple times, consent-related exclusions, bot filtering, and attribution windows can all change the rate.
- Who benefits from the framing. A vendor reporting on its own customers has a perspective to disclose. That does not make the figure wrong, but it is not independent evidence.
A site reporting 0.9% against the 1.1% reference may have a messaging problem, attract lower-intent traffic, or count a higher-friction event than the benchmark. The rate alone cannot distinguish among those explanations.
Before changing a pricing page based on a published rate, define the test. A/B testing best practices explain how sample size and test duration affect whether an observed lift is meaningful or a seasonal fluctuation.
Record the source, collection dates, and conversion definition beside each benchmark. Without those details, a rate is difficult to interpret or compare.
Finding the Funnel Stage That Is Failing
The most expensive response to a weak number is a redesign. It touches everything, takes a quarter, and usually leaves the failing transition exactly where it was.
Separate the stages before you touch the interface. A benchmark summary from Aimers makes the case for tracking visitor-to-lead, landing-page conversion, activation, trial-to-paid, MQL-to-SQL, SQL-to-opportunity and close rate as distinct measures, because a high landing-page rate can coexist with weak activation and a modest signup rate can still produce strong revenue when qualification is efficient (Aimers' SaaS conversion benchmark summary). The stage that's failing tells you which of those to check first.
| Symptom | Likely failing stage | First check |
|---|---|---|
| Traffic grows, signups stay flat | Visitor to signup | Message match and CTA placement on top landing pages |
| Signups grow, paid customers stay flat | Activation to paid | Whether new accounts finish the first workflow |
| Signups arrive, few activate | Signup to activation | Time to first value and empty states |
| Trials start, few pay | Trial to paid | Pricing page and trial length against the activated cohort |
| Leads arrive, few become opportunities | Lead qualification | MQL to SQL acceptance rules |
A failure case, illustrative. A landing page converts 6% of visitors, the team ships the win to the board, and paid revenue stays flat for two quarters. The 6% was never the problem. New accounts arrive, open the dashboard, see an empty state with no sample data, and leave before finishing the first workflow. The strong top-line number hid the leak because nobody multiplied it by the next stage.
That's the pattern worth internalizing: a page-level win can be entirely real and still contribute nothing, because the funnel below it decides what the win is worth.
Fix one stage. Rerun the same cohort. Then decide whether to move upstream or downstream. If the drop sits between signup and activation, the fix belongs in the product rather than the marketing site, and UX-driven CRO advice from Figr covers the interface questions that come next.
Frequently Asked Questions
What is a good SaaS conversion rate?
There's no universal figure, because the answer depends on which event you count. Unbounce's 2024 report put the median SaaS landing-page conversion rate at 3.8%, with the top quartile reaching 11.6% or better, per Ivy Forms' benchmark roundup. A free-to-paid rate such as ChartMogul's 8% median divides by signups instead, so it isn't comparable to the page figure.
Why do benchmarks from different sources disagree?
They use different numerators, denominators and windows, and most articles drop those details when quoting. A trial-to-paid study counts started trials, a free-to-paid study counts all signups, and a landing-page study counts form submissions. Compare only rows that share your event, base and measurement window, and ignore the rest.
Is freemium worse than a free trial?
Not by yield alone. In published benchmark data, opt-in and card-required trials both produced around 13 paying customers per 1,000 visitors, while freemium produced roughly 4.4 to 5.3. Freemium closes that gap only if its paying users retain longer, expand seats or cost less to acquire. If they churn within two months, the trial model wins.
Should a trial require a credit card?
Often, but the decision is about who you want in the denominator. A 2025 dataset of 86 SaaS companies showed card-required trials converting far more of their signups than card-free ones, though the figures don't rank companies. A card filters casual browsers and can suppress volume among buyers who need procurement approval first.
How long should I measure trial conversion?
Pick a fixed window before you look at the data, typically 30, 60 or 90 days from signup, and use that same window whenever you compare against a published rate. Changing the window after the fact turns a measurement into an argument. B2B purchases close slower than consumer ones, so a seven-day cut understates almost every enterprise motion.
Setting Your Own Target From a Cohort Baseline
Published benchmarks tell you what's possible somewhere else. A cohort baseline tells you what's next for your product, and it's the only number you can act on without guessing.
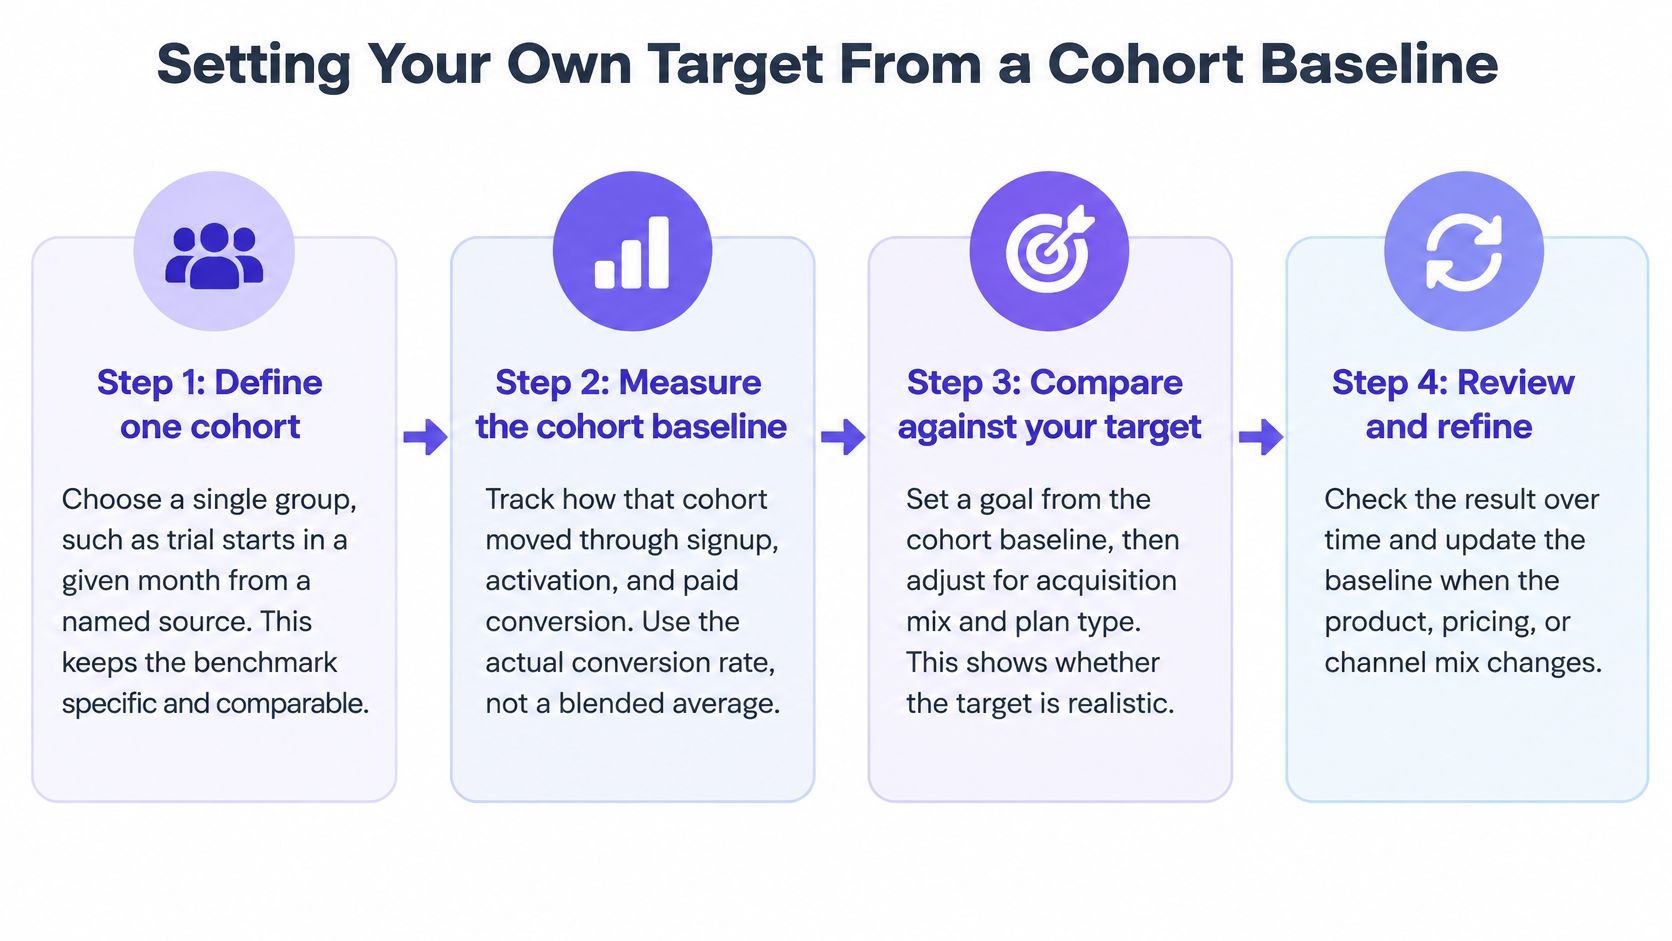
The steps below take about a week of instrumentation work and replace every borrowed target with one you can defend.
Step 1. Define one cohort.
Choose a single group, such as trial starts in March from organic search. Name the source, the plan and the date range.
A cohort that mixes paid social with branded search tells you nothing about either.Step 2. Instrument the activation event.
Identify the workflow that predicts payment for your product: importing a design system, capturing a live product screen, running the first export.
Track completion as its own event, before anyone touches onboarding.Step 3. Fix the window.
Choose 30, 60 or 90 days and commit to it. Measure paid conversion from the activated denominator, not from all signups.
A window chosen after the results is a story, not a measurement.Step 4. Segment the cohort.
Split by channel, self-serve or sales-assisted motion, and time to first value. Add company size from your own data, since published cuts are scarce.
Segments are where a flat average turns into a decision.Step 5. Compare against one matching row.
Use the benchmark that shares your denominator and window, never the headline median. A trial-to-paid cohort belongs beside trial data, not beside a landing-page rate.
One mismatched comparison can send a quarter of work in the wrong direction.Step 6. Set the target as a range.
Build it from your last two or three cohorts rather than from a single month. The benchmark becomes a reference point at the edge of the range.
Ranges survive seasonality. Point targets don't, which is why measuring UX with Figr treats trend lines with the same weight as single readings.Step 7. Change one thing at a time.
Treat a lift as real only if signup quality held steady across the same period. A cheaper signup that never activates shows up as conversion growth and revenue nothing.
Analytics signals become testable UX questions: why users drop, what they may not understand, which states deserve review. Figr does that work from context that can include funnel observations, product behavior notes, spreadsheets and exports, support evidence and design constraints.
The next action fits in one meeting. Pick the cohort you'll defend, then write its numerator, denominator and window on a single line and put that line at the top of the dashboard where the rate lives. Everything else in this article becomes a reference once that line exists.
Benchmarks are useful right up to the point where they replace your own data, and many teams never build the cohort baseline that would tell them which row applies. Figr starts from your live product rather than a blank canvas, captures your app and design system, and turns funnel evidence into testable UX questions and reviewable states, so a conversion problem becomes a specific design decision instead of a guess. If you'd rather diagnose the failing stage than redesign the whole site, see how Figr works and run your next funnel review against your own product context.