
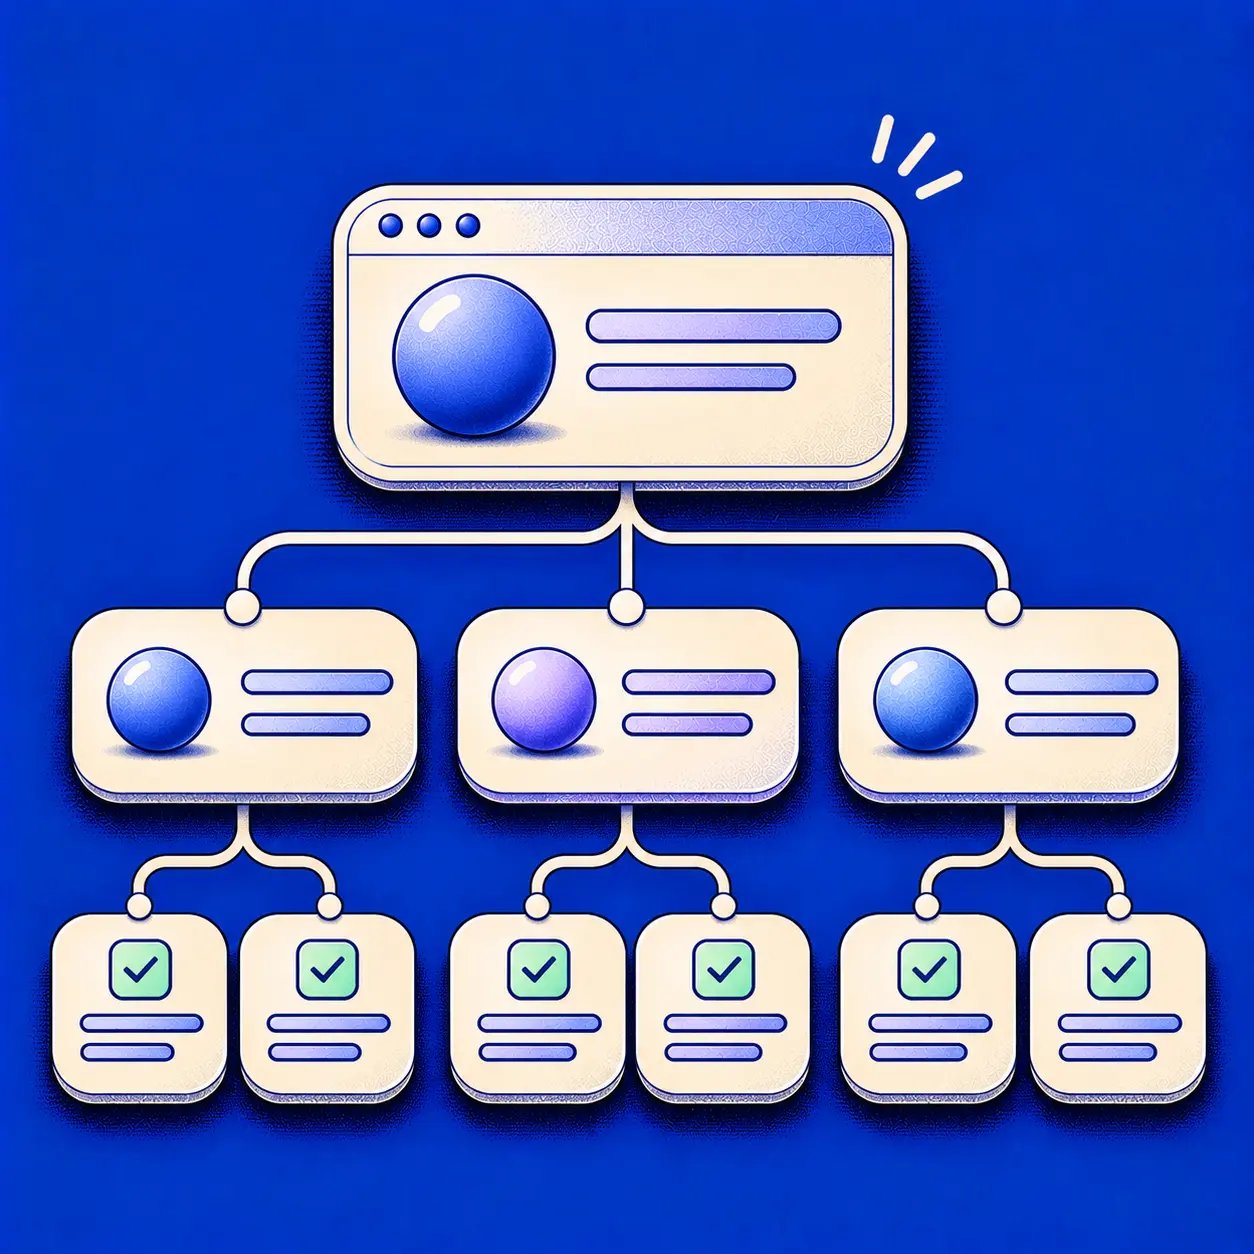
A planning board full of confident feature cards is not a discovery practice. Most of those cards arrived with a sponsor, a date, and no shared record of the customer problem they were supposed to change.
When that pattern holds, engineering time goes to ideas that never had to survive a test. Two teams can ship the same quarter and still miss the behavior the business needed, because nobody wrote down what evidence would have killed a request. The backlog stores untested assumptions.
An opportunity solution tree supplies the missing record. It ties one measurable outcome to customer opportunities, competing solutions, and the assumption test that could invalidate each path, so a feature has to explain why it exists before anyone builds it.
The Four Layers of an Opportunity Solution Tree
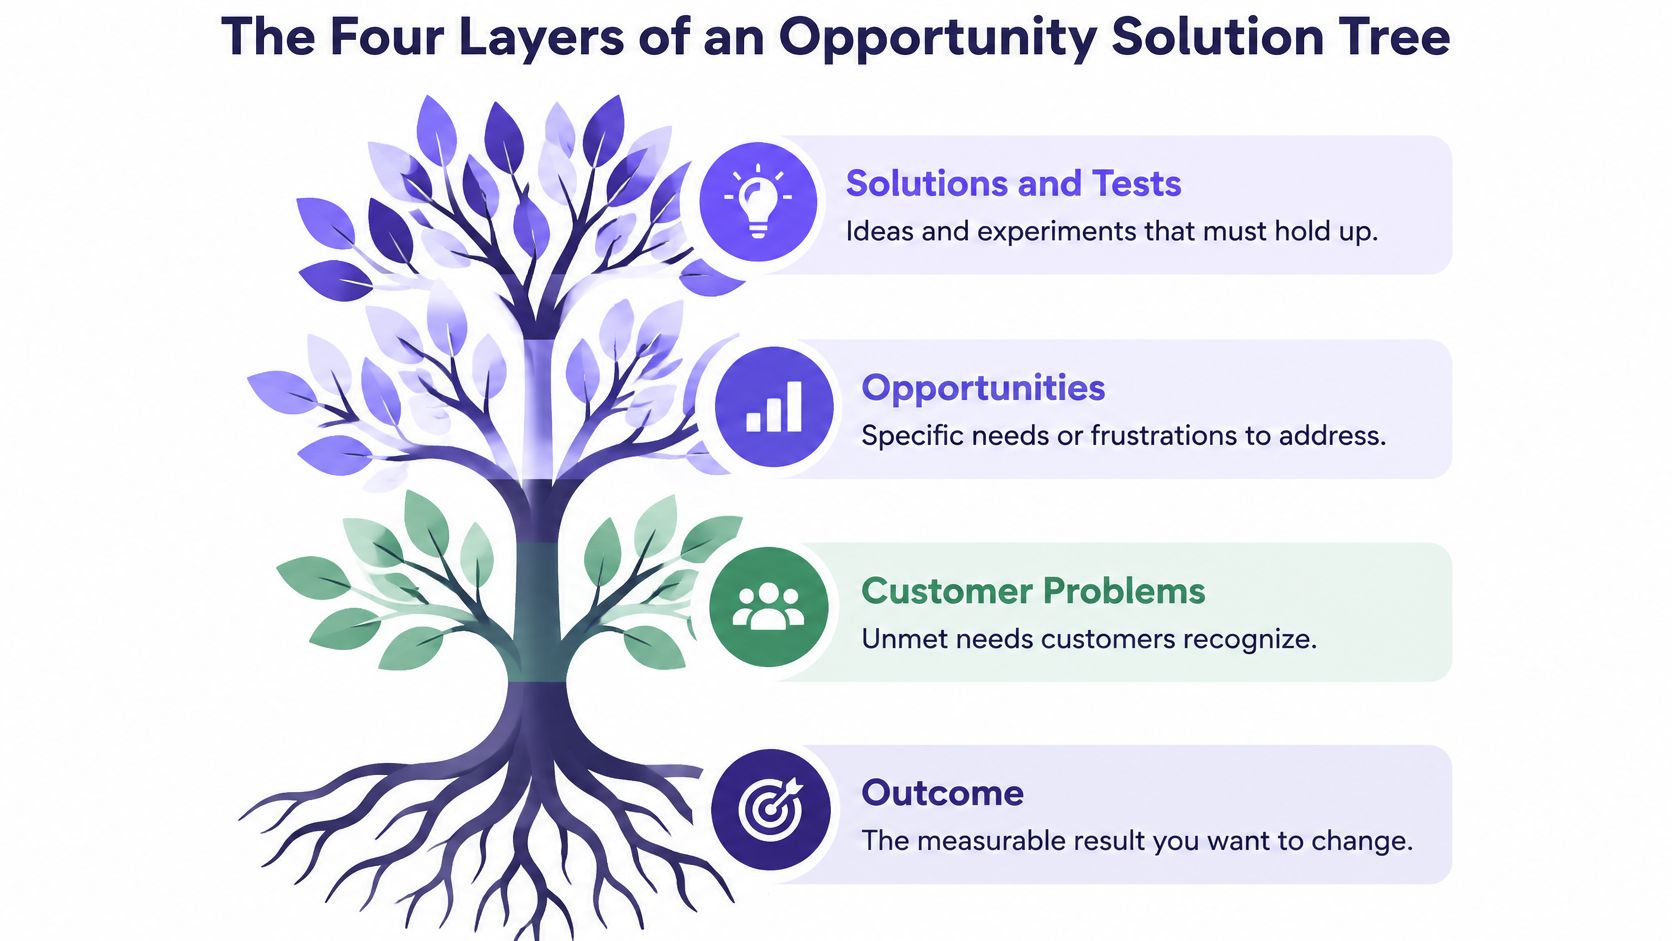
Read the tree from the top down. The outcome sits at the top as the root. Opportunities branch below it, solutions sit under those, and assumption tests hold the lowest level. Each layer has to answer to the one above it, or the card comes off the board.
An opportunity solution tree is a visual model that connects a measurable outcome to customer opportunities, candidate solutions, and assumption tests. Amplitude's guide to the opportunity solution tree describes those four layers in that order: a measurable business or product outcome, customer opportunities, possible solutions, and assumption tests. The outcome expresses the business value the team is responsible for creating. Opportunities are needs, pain points, or desires. Solutions are proposed product changes. Tests are experiments that ask whether those solutions can work. That chain is what stops a team from jumping from a broad goal straight to a favored feature.
What each layer holds
Layer: Outcome (root)
What it holds: Measurable change in customer or business behavior
Example: Raise free-to-paid conversion
Question it answers: Would we know if it worked?
Layer: Opportunities
What it holds: Customer needs, pain points, and desires, written from the customer side
Example: I can't tell which notifications are urgent
Question it answers: Is this a problem customers actually have?
Layer: Solutions
What it holds: Candidate product changes, at least three per opportunity
Example: Notification categories, a digest email, a priority inbox
Question it answers: Does this change address that opportunity?
Layer: Experiments
What it holds: Tests of the riskiest assumption behind each solution
Example: Five prototype walkthroughs, a fake-door button
Question it answers: What must be true for this to work?
Take a SaaS product with a 2% free-to-paid conversion rate, 200 paying customers out of 10,000, the baseline in a 2024 Product Compass case. A root of "raise free-to-paid conversion" only earns its place if that baseline is already known. Without the number, "would we know if it worked?" has no honest answer, and the layer below inherits the vagueness.
Under that root, one opportunity can read I can't tell which notifications are urgent. Notification categories sit under it as one solution, with a prototype walkthrough under that. I would apply a traceability test before any idea stays on the board: pick any solution and trace upward through its opportunity to the outcome, then ask what test result would remove it. A branch that cannot complete that path is a feature request disguised as a discovery finding, and the tree exists to expose exactly that.
Practical rule: Draw the whole tree on one whiteboard page before you open a tool. If the chain breaks on paper, software will only hide the break.
Why Teams Moved From Feature Lists to Outcomes
Say a PM at a Series C company walks into planning with 140 requests. Each one has a confident sponsor and a deadline. None of them share evidence about which customer problem they solve. The room argues about dates, then leaves with the same pile.
Product-discovery practitioner Teresa Torres introduced the opportunity solution tree in 2016 as a visual method for connecting product decisions to customer needs and measurable outcomes, as described in this account of continuous discovery. The shift it formalized is specific. Teams define the behavior they want to change first, investigate the customer problems that could influence it, compare several solutions, and test the riskiest assumptions before engineering starts.
Torres later placed that tree inside Continuous Discovery Habits (2021). The book treats the tree as part of an operating model, not a workshop poster. Product managers, designers, and engineers take part in discovery directly, with customer contact at least weekly, rather than waiting on a research handoff. The diagram is also a decision record: why a solution is being considered, which opportunity it addresses, and what evidence could invalidate it.
Shipping a feature is visible, and most companies reward it. Learning that a feature was wrong is quiet, and almost nobody records it. Backlogs fill with assumptions that never had to answer to an outcome. The tree counters that incentive by making every request serve a result the team can measure, which is also how a product roadmap should be fed.
A Worked Tree and a One-Page Template
Copy this layout onto one page. Keep the outcome at the top, opportunity branches under it, solutions under each opportunity, and an evidence note with a date and a source on every node. Anything without a source is labeled a hypothesis. The tree should never hide what the team has not verified.
Outcome. Raise free-to-paid conversion from 2% (200 paying customers out of 10,000) toward a target taken from the team's own baseline, measured monthly.
Branch one. Opportunity: "I hit the free limit and can't tell what the paid plan would offer."
- Solution A: a plan preview shown at the limit. Riskiest assumption: users who see the preview want the feature enough to upgrade. Test: a fake-door button on the limit screen, counted for clicks over two weeks.
- Solution B: a usage summary email sent before the limit.
- Solution C: a time-limited trial of the paid feature.
Branch two. Opportunity: "I don't know which project to start with after signup." Give it its own three solutions and a dated test under each, the same way as branch one.
Why the evidence note matters: a node without a source looks as solid as a node with ten interviews. Label the gap. The basic gist is this: the page is a decision record, so a reader six weeks later can see what was known, what was guessed, and which assumption the next test was built to break.
If a stakeholder cannot point to the opportunity and the test, the item does not belong on this page yet.
How to Build Your First Tree Step by Step
Growth teams can use analytics context for funnel and activation questions, and product teams can use it to connect behavior signals to UX decisions. Fix the starting number before anyone sketches a branch.
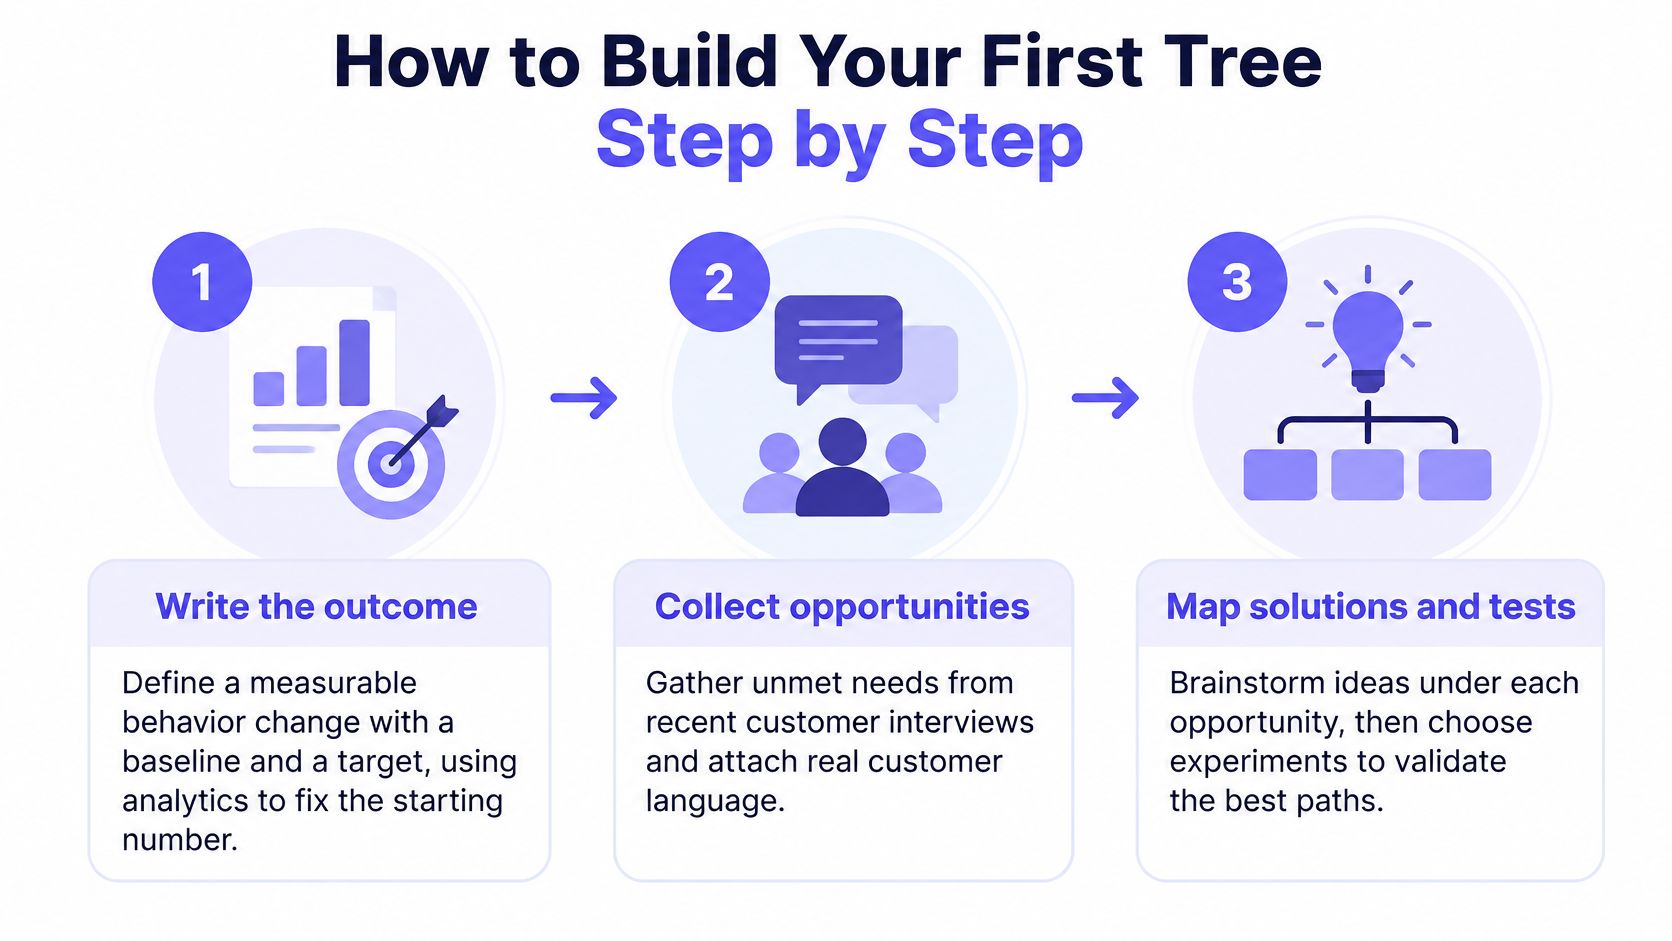
Step 1. Write the outcome as a behavior change.
Include a baseline and a target, taken from analytics, not from a slide.
A delivery target such as "ship categories in Q3" fails the root test.
Slip: picking a company-wide number the team cannot move this quarter.
Step 2. Collect opportunities from recent interviews.
Attach each quote to the branch it supports, with the date and the segment.
Old support tickets can seed a branch, but they do not replace a current conversation.
Slip: writing the opportunity in internal language before the quote is on the page.
Step 3. Cluster and nest.
Put broad needs above the specific problems that contribute to them.
Three near-duplicate lines should become one parent and two children.
Slip: a flat list of twenty pains that all look equally urgent.
Step 4. Select one target opportunity.
The team works one branch, not the whole space.
Park the rest where everyone can see them.
Slip: brainstorming across every branch because each sponsor is in the room.
Step 5. Generate at least three solutions.
Do this before judging any of them.
Distinct means different mechanisms, not three skins of the same feature.
Slip: stopping at the idea that sounded right in the first ten minutes.
Step 6. Name the riskiest assumption and the cheapest disproof.
One belief per solution. One test that could show it is false.
Cheaper beats thorough when you are still unsure the opportunity is real.
Slip: building a thin slice because the calendar had room, not because the assumption demanded it.
Step 7. Record why the winner won, and what would reverse it.
Write the criteria and the evidence in one short note.
A reversal condition keeps the choice from hardening into dogma.
Slip: "we decided" with no sentence a skeptic can check.
A finished first tree is small on purpose. One outcome. A few opportunities, with one marked as the target. Three or more solutions under that target. A dated record of evidence on the nodes you are willing to defend. If the page cannot be read in one standing meeting, it is already too wide.
Writing Opportunities the Customer Would Recognize
The line that decides whether a tree holds up is wording. An opportunity describes an unmet need. A solution prescribes a fix. Mix those and the branch collapses into a feature request with extra boxes around it.
Set the two lines side by side. "I can't tell which notifications are urgent" describes an unmet need. "We need notification categories" prescribes the answer inside the problem. The continuous discovery habits method notes treat that framing as the main rule: opportunities are written from the customer's perspective, not as feature requests. Teams can then nest related opportunities, separating a broad need from the specific problems that contribute to it.
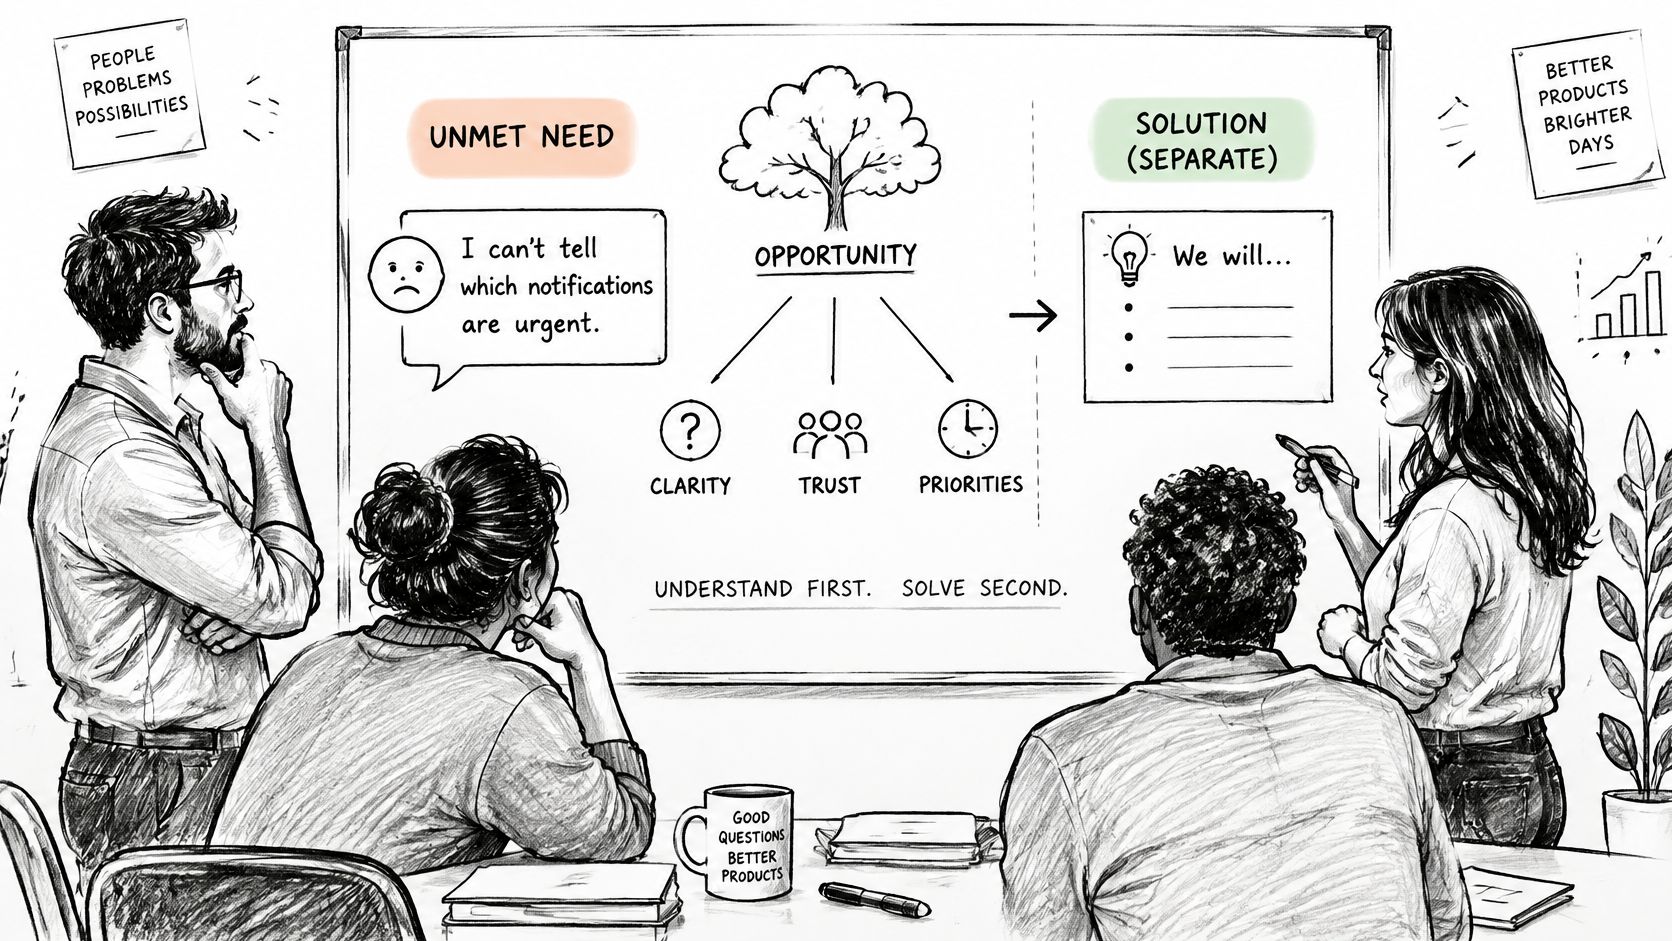
One customer opportunity can support several competing solutions. That is what lets a team compare approaches instead of treating the first proposed feature as the answer. Notification categories, a digest, and a priority inbox can all sit under the same urgent-notification need. If the opportunity had been written as "build categories," the other two ideas would never have been drawn.
Nesting that stays readable
Parent: getting started with a new project.
- Child: "I don't know which project to start with."
- Child: "I can't find the setup steps after signup."
The parent names the job. The children name the moments where the job breaks. Solutions hang off the children, where a test can be specific.
Use this filter before a branch stays. It is a quality check, not a grammar exercise.
- Customer side: the sentence could be said by a user, not by the team.
- A who and a situation: someone, in a moment, hits a snag.
- No feature word: categories, dashboards, and buttons belong one layer down.
- A source: a conversation or a metric, captured with your user research methods.
An opportunity with no source stays marked as a hypothesis until evidence arrives. Guessing in the customer's voice is still a guess.
Generating Three Solutions and Testing the Riskiest Assumption
Generate at least three distinct solution ideas for each target opportunity before you evaluate any of them. The practice note on building opportunity solution trees uses that rule to counter solution fixation, the habit of mistaking the first plausible feature for the best response to a customer problem.
Compare the alternatives on four criteria: likely impact on the target opportunity, technical effort, risk, and fit with product direction. The tree makes overlap visible. You can see which ideas answer the same opportunity instead of scoring each feature in isolation, the way a backlog review usually does.
Before you commit to screens, ask clarifying questions, map the current flow, identify friction, list missing states, and explain the tradeoff. That review of the UX logic is cheaper than a wrong build, and it often kills a solution that only looked distinct on a sticky note.
Then write the single belief that would sink the solution if it were false. Pick the cheapest test that could expose it. Match the test to the assumption, not to the calendar. A prototype walkthrough can show whether users understand a flow. It cannot show whether the flow moves the outcome. That question belongs to a fake-door test or a thin-slice build. Time and cost below are planning ranges, not benchmarks from any one product. When you need a controlled comparison in production, follow sound A/B testing best practices.
Test: Customer interview
Typical time: 1 to 2 days
Cost: Low
Best at testing: Whether the opportunity is real and how often it occurs
Test: Prototype walkthrough
Typical time: 3 to 5 days
Cost: Low
Best at testing: Whether users understand the flow and the solution
Test: Fake-door test
Typical time: 1 to 2 weeks
Cost: Low
Best at testing: Whether anyone clicks toward the solution
Test: Concierge test
Typical time: 2 to 4 weeks
Cost: Medium
Best at testing: Whether the outcome improves when value is delivered by hand
Test: Thin-slice build
Typical time: 4 to 8 weeks
Cost: High
Best at testing: Whether the solution moves the outcome in production
Would you spend four to eight weeks to learn something a fake door could have shown in two? I would not.
Running the Tree With Product, Design and Engineering
Picture a Tuesday planning meeting that still happens in plenty of product orgs. The designer arrives with three screens. The engineer arrives with a list of constraints. The product manager arrives with a feature already promised to a sales lead. The tree changes that conversation by putting the outcome and the evidence on the table first.
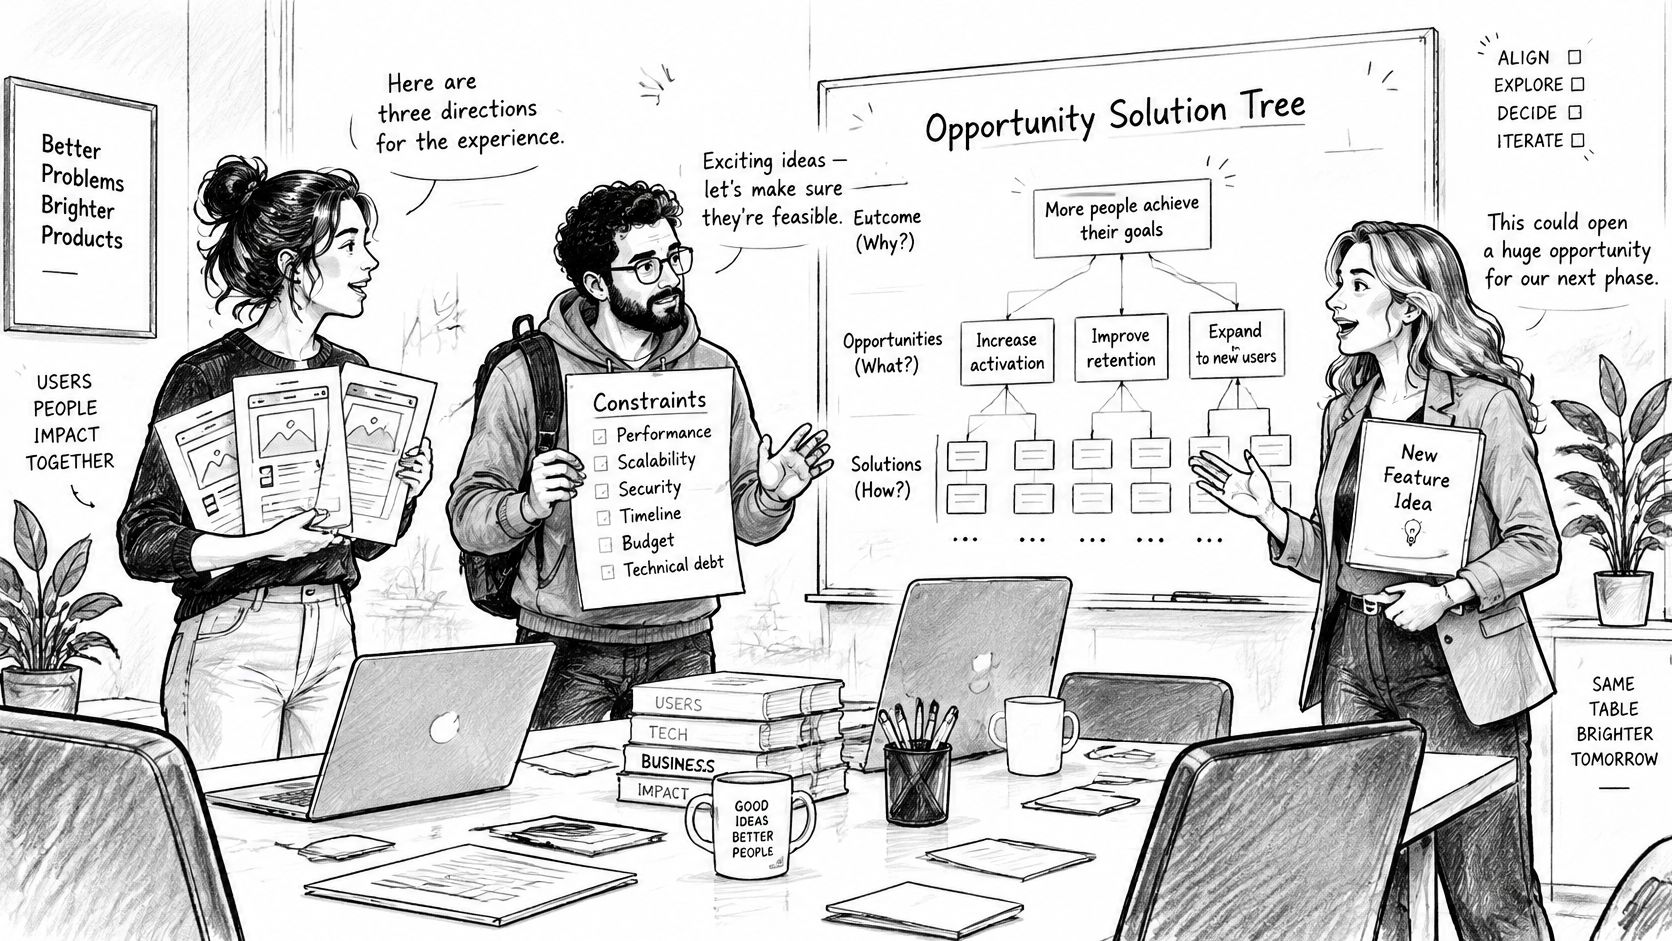
Product Talk's account of where the tree came from frames it as an iterative evidence loop, not a one-time workshop. Continuous interviewing discovers and refines opportunities. Assumption testing asks whether a solution can address the one you selected. Both repeat as the team learns. After each research cycle, attach customer evidence to branches, keep one target, generate competing solutions, and test the riskiest assumptions before you commit engineering capacity. That record is why a solution was selected, and it preserves the alternatives you did not pick.
- Product manager: owns the outcome and the opportunity branches, and refuses work that fails the traceability test.
- Designer: maps the flows and runs the prototype tests that can disprove a solution cheaply.
- Engineer: assesses feasibility and effort for each option before anyone treats a sketch as a commitment.
The operating cadence is customer contact at least weekly. That is a minimum for current evidence, not a stretch goal. A tree updated once a quarter is a souvenir.
Who pays for the handoff? When research lives on a separate team, the people who change the product rarely hear the customer. The tree becomes a summary of someone else's notes, and the nuance that would have killed a solution gets flattened. Strong developer handoff best practices still cannot replace that missing conversation.
Everyone who can change the product should attend at least one interview each cycle. If only one role hears the customer, the tree will drift back toward whoever speaks loudest in planning.
Common Failures and How to Keep the Tree Honest
The most common failure is a feature backlog with arrows drawn between the boxes. It looks structured. It still cannot tell you what evidence would kill a branch.
A tree only stays decision-grade when the evidence behind it is strong. Weak, conflicting, or stale signals produce a misleading map, and a broad outcome makes almost any opportunity look relevant. Demand for research is rising while capacity is not: 55% of organizations reported increased demand for user research in the past year, and 63% identified time and bandwidth as their leading challenge, according to this product-management framework note. Speed without labels is how a bad quote becomes a roadmap item.
Symptom: Tree reads like a feature backlog
Likely cause: Opportunities written as features
Fix: Rewrite each branch as a customer need and delete feature branches
Symptom: Every branch looks important
Likely cause: Outcome too broad to rule anything out
Fix: Narrow the outcome to one measurable behavior with a baseline
Symptom: Tree never changes
Likely cause: No evidence attached after research
Fix: Attach each interview or metric to its branch with a date, weekly
Symptom: Two strong branches, no decision
Likely cause: Solutions never compared
Fix: Require three solutions for the target before ranking
Symptom: Weak evidence drives the choice
Likely cause: One quote or metric treated as proof
Fix: Label evidence strength and prune branches with no recent support
How to label a node
On each opportunity, note four things: evidence strength, customer segment, recency, and any counterexample. A sharp quote from one power user is not the same as a pattern across eight recent interviews in the segment you sell to. A metric that moved last year is stale if the workflow has changed.
Prune a branch when no recent evidence supports it. A pruned branch is a result. It shows where attention should not go, which is as useful as a green light on the branch you keep. In short, an honest tree gets smaller as the team learns, and a frozen tree only gets more confident.
Confirm Your Outcome Before You Draw the Next Branch
Pick one outcome the team already tracks. Write the current baseline and a realistic target from analytics, and watch it with dashboards and alerts for guardrail metrics so a local win does not unintentionally hurt something else.
Schedule five customer conversations about the part of the journey where that outcome stalls. Write each opportunity in the customer's words, with the source attached.
Draw one page. Outcome at the root. One target opportunity. Three solutions beneath it.
For the riskiest assumption under each solution, pick the cheapest test that could disprove it, and set a date.
When you already have a PRD and product context, that document can be turned into flows, questions, UX decisions, edge cases, and screen directions. That pass can catch edge-case states a team would otherwise miss. Engineering still owns the final feasibility call.
Before the next planning meeting, answer one question: which branch would you drop if the evidence came back negative?
Figr helps product teams turn an outcome, a PRD, and real product context into flows, edge cases, and prototypes you can test before engineering commits. Use it when an opportunity solution tree has a target branch and you need the missing states and questions on the table, not another feature list. Visit Figr to run that pass on the branch you are about to bet on.