
To create an ERD, you identify the core nouns of your system, your entities. Then you define the verbs that connect them, which become your relationships. This process turns abstract requirements into a concrete plan, the critical first step before a single line of code is written.
The Blueprint Before the Build
Most product specs fall apart in the gaps between features and data. They describe what a user sees, not how the system thinks. An ERD closes those gaps.
Think of it like this: your product isn't a conveyor belt of features, it's a switchboard. An ERD is the diagram that shows which sockets connect to which plugs. Without it, you’re just hoping the lights turn on.
This is not a new idea. In his 1976 paper, "The Entity-Relationship Model: Toward a Unified View of Data," Peter Chen laid the groundwork for this entire field. What he saw then is even truer now: a shared visual model is the fastest path to a shared mental model.
Why a Visual Map Prevents Product Chaos
Without this map, every team operates on its own set of assumptions. A designer mocks up a screen assuming a user has one profile, while an engineer builds a backend that allows for many. Does that sound familiar? This misalignment is the root cause of most feature delays and brittle codebases.
An ERD forces these conversations into the open.
It creates a single source of truth that aligns your entire team. I watched a PM present a new notifications feature last week. The debate immediately fractured into questions about UI and delivery channels. But the real problem was the data: what triggers a notification? Who can receive one? What information must it contain? These are ERD questions.
This is what I mean: the quality of your product's logic is a direct reflection of how well you've defined the relationships between its core concepts. An ERD makes that quality visible.
This diagram is a critical piece of your project's overall system design architecture. It defines boundaries and clarifies scope. When you can see the system, you can reason about it effectively.
Knowing how to create an ERD is less about drawing boxes and lines and more about thinking with structural clarity.
It’s the blueprint that turns a loose collection of features into a coherent, scalable system.
From Abstract Ideas to Concrete Entities
Your product isn’t a collection of screens. It’s a system of interconnected concepts. The first and most important step in creating a useful ERD is to translate those abstract ideas into concrete blocks called entities.
What does that mean in practice?
Look at your application and name the core "things" your system manages. The fundamental nouns. If you're building a project management tool, your entities are Project, Task, User, and Comment. These are the pillars of your system.
Finding these entities is like locating the load-bearing walls of a building. Once you know where they are, you can start hanging things on them.
Finding Nouns and Their Properties
Those "things" you hang on the walls are the attributes, the properties that describe each entity. A Task entity isn't just a shapeless idea, it has specific characteristics. Does it have a dueDate? A status? An assigneeId? Each of these is an attribute.
This is where your product's logic begins to take shape.
You're moving from a vague inventory to a specific one. You don't just own "furniture." You own a brown leather sofa with three cushions and a small coffee stain on the right armrest. That detail is what makes a data model useful.
I was helping a startup map out a social feature last year. They kept talking about "posts." But what was a post? After a 20-minute whiteboard session, we identified three distinct entities:
Post: The main container holding text content and a timestamp.
Media: An associated image or video file with its own URL and type.
Mention: A link to another user's profile embedded within the post's text.
Suddenly, "post" wasn't one thing anymore. It was a system of three connected concepts. This clarity is the entire point. A user profile screen isn't an entity, the User is. The screen is just one way of looking at it.
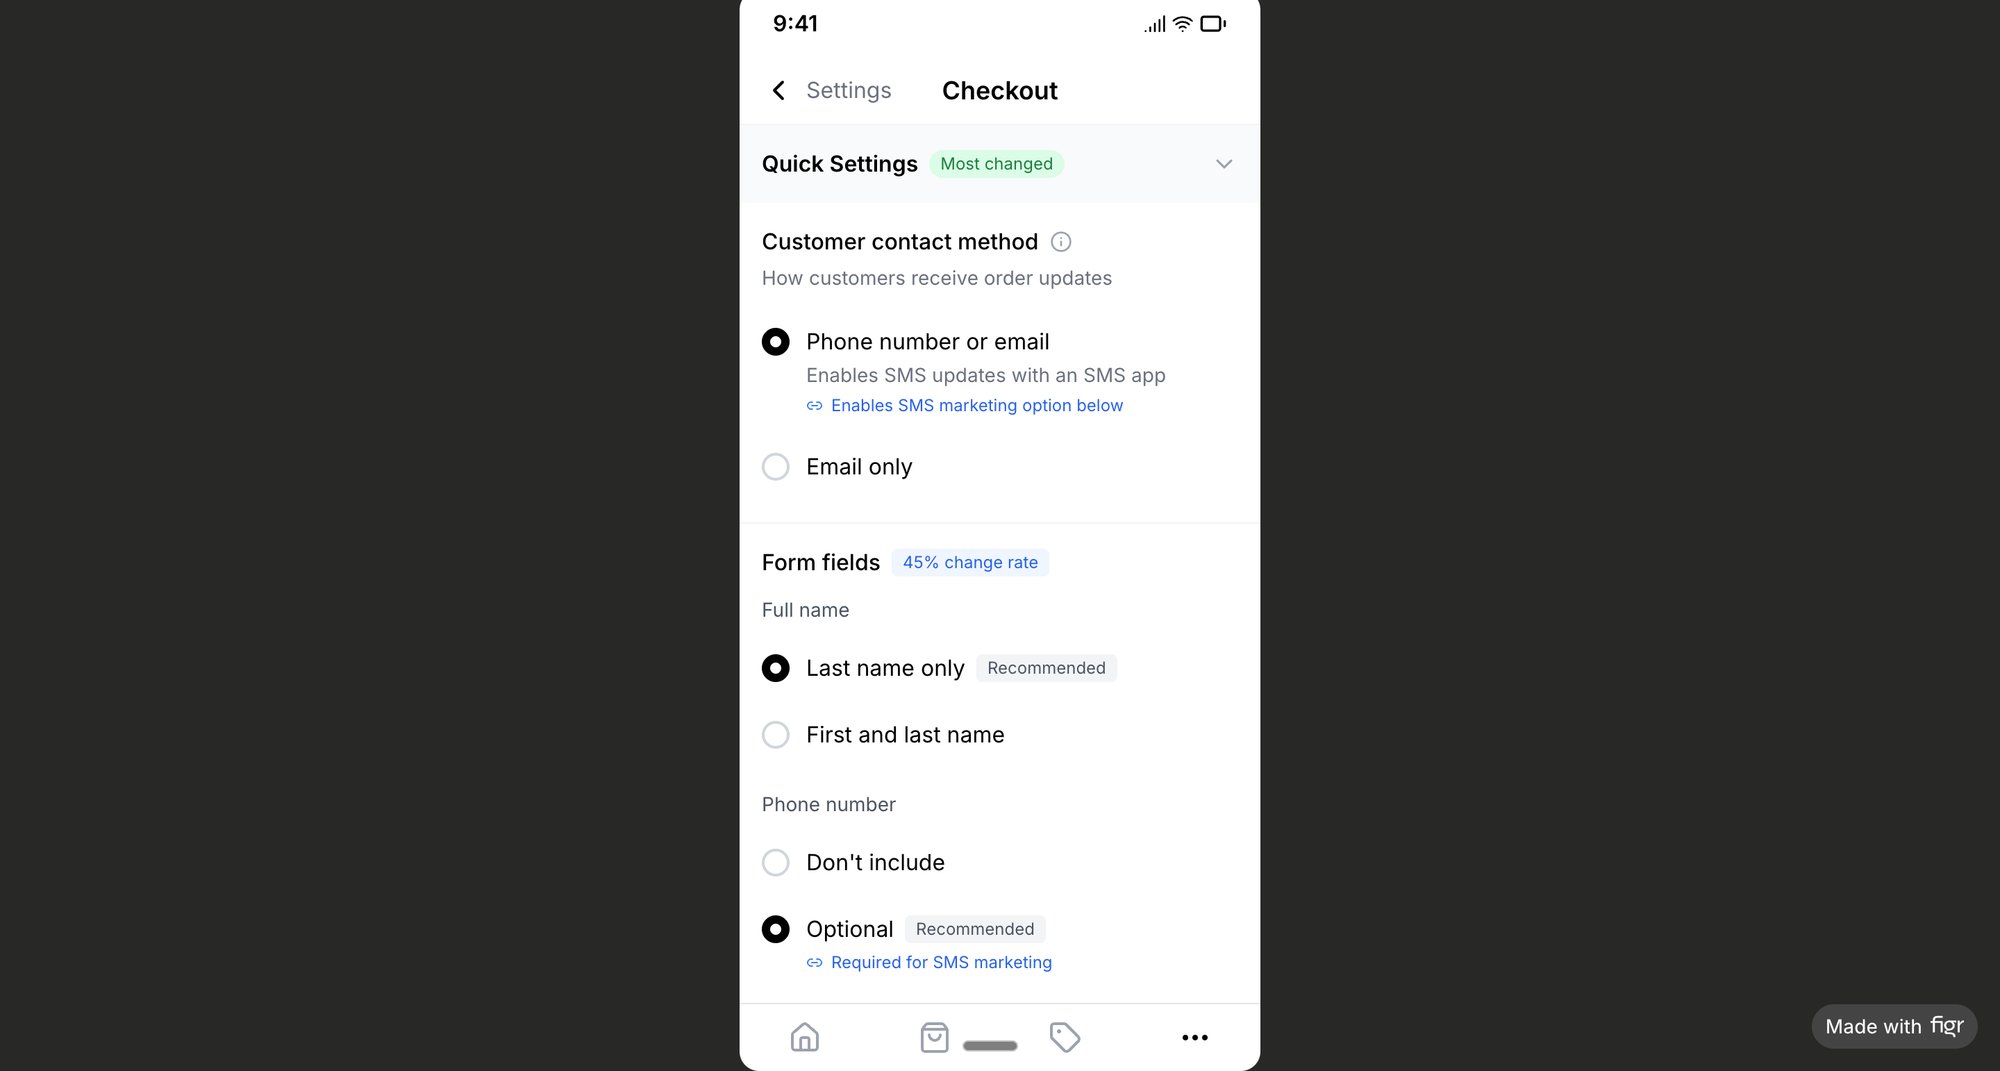
This process deconstructs complexity. For instance, analyzing a feature as intricate as a Shopify checkout setup can feel overwhelming. But if you capture the user flow, you see the entities emerge: Store, Customer, Product, and Order. Each screen reveals the attributes and relationships that connect these core components.
A surprisingly effective technique is to screenshot your app's main flows and draw boxes around the nouns. This is especially powerful for understanding an existing application. You can learn more about turning visual flows into structured plans from guides on freeware process mapping software.
Ultimately, you are turning the visual language of your UI into the structural language of data. This act of translation is the first, and most critical, step.
Defining the Connections That Matter
Entities on their own are just lonely boxes. The connections between them are what breathe life into your product. These relationships are the verbs in your product’s story: a User assigns a Task; a Comment belongs to a Project.
This is where the tangible logic of your product finally emerges.
But simply drawing a line isn't enough. You must define the rules for that line. This is cardinality, and it’s where ambiguity creeps in, leading to a world of pain in the form of bugs and rework.
The Rules of Engagement
Think of cardinality as the rules of engagement for your data. It answers critical questions with precision. Can one task have multiple assignees, or only one? Can a project exist without any tasks? Getting these rules right is non-negotiable.
The basic gist is this: you’re defining the numerical relationship between two entities. You'll encounter three main types:
One-to-One (1:1): One
Userhas oneProfile. It’s rare but important, often used for security or partitioning large chunks of data.One-to-Many (1:N): One
Projecthas manyTasks. This is the workhorse of most applications. It's how you model any container-item relationship.Many-to-Many (M:N): Many
Studentscan enroll in manyCourses. This signals a flexible connection that almost always requires an intermediate table to manage properly.
I once saw a team building an event platform model Ticket and Attendee as a one-to-one relationship. It seemed logical, until they hit the wall of group ticket sales. The entire checkout flow had to be refactored because their model couldn't answer the question: what happens when one person buys ten tickets?
A simple cardinality mistake cost them two weeks.
Cardinality isn't just a technical detail. It's a fundamental product decision that defines how your system behaves.
Speaking a Common Visual Language
So how do you represent these rules? You need a shared notation. While several exist, Crow’s Foot notation is the industry standard for a reason: it’s incredibly intuitive.
It uses simple visual cues at the end of each relationship line to show the connections. A single hash mark means "one," a circle means "zero," and the three-pronged "crow's foot" means "many."
By combining them, you can express rules like "one and only one," "one or many," or "zero or one." Anyone on your team, technical or not, can learn to read it in minutes. This is what turns your diagram into a universal source of truth.
By defining relationships this way, you make the implicit rules of your system explicit, a critical step in any kind of task analysis for product development. Your ERD transforms from a collection of nouns into a complete sentence diagram for your product’s logic.
Refining Your Model Through Iteration
Your first ERD is never the final one. It's a ghost, a faint outline of your system’s logic, full of untested assumptions. Like any good design, it needs to be put through the wringer. It requires iteration, a process of stress-testing the model against the messy reality of how people will actually use it.
This is where you start asking the hard questions. What happens when a user is deleted? Does their data cascade into oblivion, or does it get orphaned, floating in your database forever? These questions lead to the concept of normalization.
Tidying Up Your Data's Home
Normalization isn't just complex database theory. For a product manager, it’s a practical process of tidying up. You're making sure that each piece of information has one, and only one, place to live.
If you find yourself storing the same data in multiple tables, you're building a time bomb.
A friend at a Series C company told me their team spent an entire month refactoring their billing system. The culprit? Their initial model stored the customer's subscription plan name in five different tables. When they updated their pricing, chaos erupted. All because one piece of data had too many homes.
This is where understanding relationship rules becomes critical. It's often the first thing to break in a model that isn't properly normalized.
This diagram shows the fundamental choices you make about how entities connect. In my friend's billing disaster, their model treated "plan name" as a simple attribute instead of a relationship to a single Plans entity. That one mistake caused all the trouble.
Stress-Testing with Real Scenarios
Iteration isn't just a thought exercise. You must actively test your model against real user flows, especially the gnarly, edge-case-heavy ones.
Let's take a practical example, like mapping the flow for a complex feature like Waymo's mid-trip stop changes. What happens if a rider adds a stop? What if they change the final destination? Each of these actions stresses your data model.
You should be asking questions like:
Does adding a stop create a new
Legentity in the trip?How is the
Tripentity’s total cost recalculated?What happens if the new stop is chronologically before an existing one?
Thinking through these scenarios is how you find the cracks in your ERD. It forces you to define how entities are created, updated, or deleted in response to user actions. For a feature this complex, you can explore a set of real test cases to see just how many scenarios your ERD needs to handle. Each test case is a question your model must answer.
A robust ERD is one that has been challenged by reality. Your goal is to find where the model breaks before your users do.
From Diagram to Development Handoff
An ERD that only lives on a whiteboard is a fossil. To be effective, it must become a living document that guides development.
Let’s zoom out for a moment. Misaligned data models are a primary source of rework. Studies suggest fixing errors post-release can cost up to 30 times more than fixing them during the design phase. Your ERD is the single best insurance policy against this kind of waste.
A successful handoff turns your diagram into a shared language. It transforms your visual logic into clear, actionable instructions for your engineering and design partners.
Translating Logic into Action
The first step is annotation. Your ERD might seem clear, but context is king. You need to add notes explaining the why behind your decisions. Why is a relationship one-to-many instead of many-to-many? What business rule dictates that an attribute can't be null? These annotations turn a diagram into a robust specification.
Next, collaborate directly with your engineers. Walk them through the model and validate technical constraints. They will see things you won't, like performance bottlenecks or the need for specific database indexes. This conversation is where the theoretical model meets physical reality.
Your ERD is also an incredibly powerful tool for UI design. A one-to-many relationship often translates to a list view in the UI. A many-to-many relationship implies a multi-select component or a tagging system. The data structure directly informs the user experience.
In short, a well-communicated ERD is your team's shared understanding made visible. A well-defined data model, like the one informing Shopify's redesigned checkout setup, shows how a solid foundation leads to a clear and intuitive user experience. The clarity of the data model directly shapes the clarity of the product.
The Grounded Takeaway From ERD to PRD
Your ERD should never exist in a vacuum. It must be embedded into your core product documentation. The most critical next step is to integrate your finalized diagram directly into your Product Requirements Document (PRD) or functional specification.
This creates a single, authoritative source of truth. When a developer builds a new feature or a QA engineer writes test cases, they can reference both the user-facing requirements and the underlying data structure in one place. A comprehensive PRD, sometimes known as a functional specification document, is the ideal home for your ERD.
This single act of consolidation prevents ambiguity and ensures the logic you modeled becomes the logic that gets built. Your diagram is now more than a blueprint: it's the law.
Questions We Hear All the Time
Even with the best guide, questions are going to pop up. That’s a good sign. It means you’re thinking deeply about getting the structure right.
Here are a few of the most common questions from product teams.
What Is the Difference Between a Logical and a Physical ERD?
Think of it as the what versus the how.
A logical ERD is the product manager's view. It’s about business concepts and what information the product needs to function. It defines the core entities, their attributes, and how they relate from a strategic lens. It answers, "What do we need to keep track of?"
A physical ERD is the engineer's blueprint. It translates your logical model into a specific database schema. This is where technical details come in, like data types (e.g., VARCHAR(255)), primary keys, and foreign keys. Your engineering partners create this based on the logical one you provide.
How Detailed Should a Product Manager's ERD Be?
Your goal is clarity, not code.
As a PM, your diagram must clearly lay out all major entities, their critical attributes, and their relationships, with the right cardinality. You don't need to specify data types or indexes.
A good rule of thumb: your ERD should be detailed enough for an engineer to build a database from it without having to guess your intent. If they’re asking you to clarify basic relationships, you haven't gone deep enough.
Can I Create an ERD from an Existing Application?
Absolutely. It’s a powerful technique called "reverse-engineering" a data model. It’s perfect for understanding a legacy system or analyzing a competitor's product. You work backward from the UI to deduce the data structure underneath.
For instance, by looking at a simple task assignment component, you can spot the core entities (Task, User, Status) and figure out how they connect. This kind of visual analysis turns a functional UI into a structural blueprint, giving you a fantastic starting point for a more formal diagram, like this user flow map.
Turning ideas into structured, actionable artifacts is the core of product management. An ERD is one of the most powerful tools in that process. But creating PRDs, user flows, and test cases still takes hours of manual work. Figr is an AI design partner that learns your live application, then helps you generate these artifacts in minutes, not days. It's how you move from thinking to shipping, faster.
See how it works at https://figr.design.