

A component library can look finished while the shipped product still feels like five products stitched together. The file has polished buttons, the team has a page of tokens, and the repository has a component folder, yet nobody agrees which version to use or who can change it.
When that gap persists, designers recreate patterns, engineers override them, accessibility defects survive into production, and Product Managers spend refinement meetings debating UI details instead of product decisions. A published library becomes a museum, full of artifacts that teams visit but rarely trust.
A design system maturity model gives that problem a useful shape. It evaluates the operating capabilities around the system, then turns weak adoption, governance, documentation, and design-code alignment into a prioritized improvement plan.
What Is a Design System Maturity Model
A design system maturity model assesses how effectively a design system helps teams create, ship, govern, and improve product experiences. It maps capability stages to the practices required at each stage and the work needed to progress.
The useful question is not how many components exist. A large Figma library can still lack semantic tokens, documented states, contribution rules, accessible defaults, or a dependable route from design to production code. Academic research describes maturity models as combinations of predefined levels, multiple maturity factors, and recommended procedures for progression in design-research scholarship on maturity model development.
Four capabilities that show where the system stands
Creation is the visible layer. It includes foundations, components, variants, templates, tokens, and patterns. Teams often start here because producing artifacts is easier than changing shared habits.
Adoption shows what reaches shipped work. A component that exists but gets bypassed because it lacks a loading state, is difficult to find, or slows engineering is an asset in name only.
Governance covers ownership, contribution, review, release management, deprecation, and decision rights. Continuous improvement connects the system to evidence such as usage, defects, accessibility findings, handoff revisions, and delivery friction.
Practical rule: Treat maturity as a roadmap of organizational capabilities, not a ranking of how impressive the library looks.
A design system may be strong in one dimension and weak in another. Nielsen Norman Group separates organizational alignment, team effectiveness, infrastructure strength, governance, support, and adoption in its design system maturity framework. This multidimensional view exposes the bottleneck hidden behind a single average score.
Google's 2020 survey shows why artifact counts can mislead. 80% of respondents said their company had built an in-house design system, and 74% reported a component code library, while only 25% said the system had existed for one to two years, according to Google's State of Design Systems research. Availability had arrived before institutional memory and operating discipline.
For a broader foundation, consult this complete guide to design systems. It helps separate system building blocks from the practices that keep them useful. Maturity lives in the relationship between assets, people, workflows, and outcomes.
The 5 Levels of Design System Maturity
The five levels below are an illustrative design system maturity framework, not a universal industry standard. They describe a practical progression from inconsistent interface work to an operational system that provides structured context for people and AI.
The progression from fragments to operating infrastructure
At Ad Hoc, teams solve interface problems locally. At Emerging, they begin sharing foundations and components. Defined introduces ownership and explicit usage knowledge. Managed connects the system to adoption, accessibility, governance, and code. Optimized treats improvement and context as ongoing product work.
This progression resembles established practitioner models that distinguish a shared UI kit, a documented design library, a code-connected design system, a scaled system, and an optional public platform, as outlined by Atomize's five-level maturity model. The labels here differ because the assessment is centered on operational behavior and AI readiness.
A shared library doesn't automatically move a team into the third level. The transition happens when people can understand why a pattern exists, choose it correctly, contribute safely, and find its equivalent in code.
The level that matters depends on context
A single-product startup may have no reason to build multi-product governance. A SaaS company with several product surfaces may need it early. A regulated enterprise may prioritize accessibility evidence and change control over visual experimentation.
That is why the level is a diagnostic label, not a badge. A system can be Managed for one product area and Emerging elsewhere. The right question is, “Which capability currently limits reliable delivery?” A perfect catalog won't compensate for an ownership vacuum.
How to Assess Your Design System Maturity
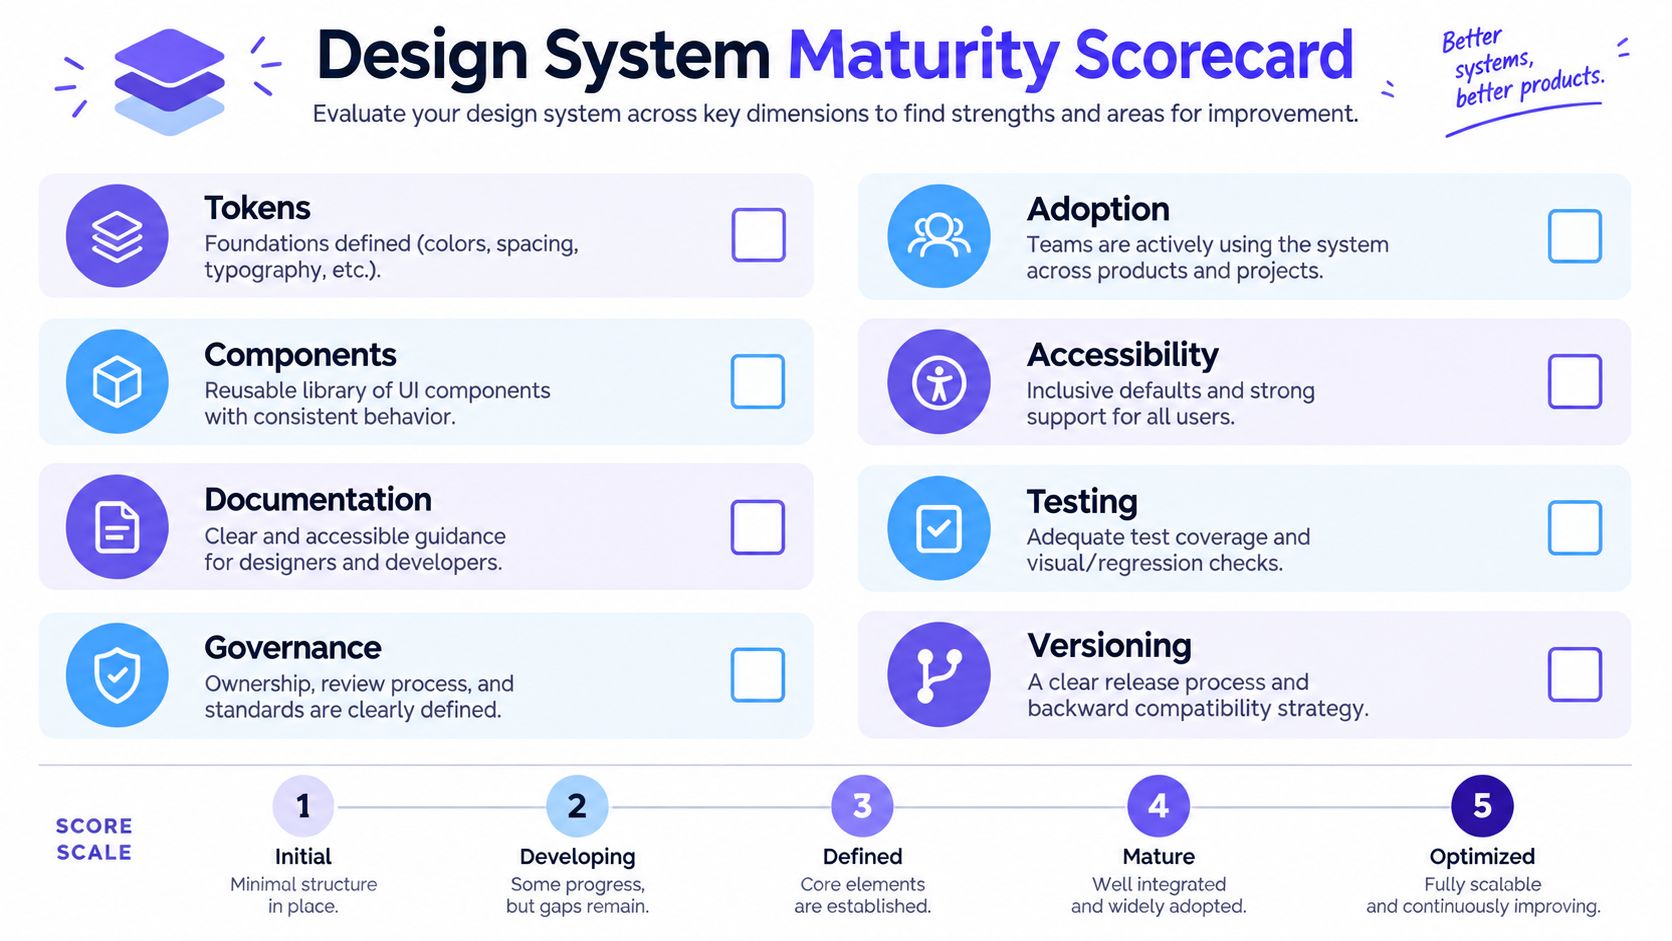
A practical design system maturity assessment scores eight dimensions from 0 to 4, for a maximum of 32 points. The thresholds below are illustrative, so use the profile of scores to guide decisions rather than treating the total as a certification.
Score capabilities, not intentions
Use the same scale for every dimension:
- 0, absent: No dependable practice or usable evidence exists.
- 1, emerging: Some work exists, but usage is informal, partial, or person-dependent.
- 2, defined: The capability is documented and available to relevant teams.
- 3, managed: Teams use it routinely, ownership is clear, and performance is reviewed.
- 4, optimized: The capability improves through evidence, feedback, and repeatable cross-team practices.
Apply that scale to these dimensions:
- Tokens: Are semantic values defined, named clearly, and connected to design and code?
- Components: Do reusable components cover meaningful product needs, including states and variants?
- Documentation: Can a new contributor find purpose, usage guidance, constraints, and status?
- Governance: Are ownership, contribution, review, release, and deprecation decisions explicit?
- Adoption: Do product teams use approved patterns in production, or work around them?
- Accessibility: Do components include accessible defaults, checks, and remediation ownership?
- Design-code consistency: Do design assets and implementation share names, values, states, and behavior?
- AI readiness: Can tools access structured tokens, metadata, guidelines, and relevant product context?
A total of 0 to 8 suggests foundational work is missing. 9 to 16 indicates an emerging operating model. 17 to 24 suggests defined or managed capability with material gaps. 25 to 32 indicates broad operational strength, provided no critical dimension remains weak.
Those ranges are only illustrative. A score of 4 for components and 0 for adoption should trigger action faster than a balanced average. NN/g's six-dimension approach supports the same principle: the shape of the capability profile reveals more than one number.
Run the assessment with a Design Lead, design-system owner, engineer, and Product Manager. Compare evidence, not opinions. Useful evidence includes production usage, release records, documented decisions, accessibility findings, and examples of recent contributions. Tools that compare design decisions with the live product can support how Figr grounds UX decisions, but the team still has to interpret the gap.
Which KPIs Measure Design System Maturity
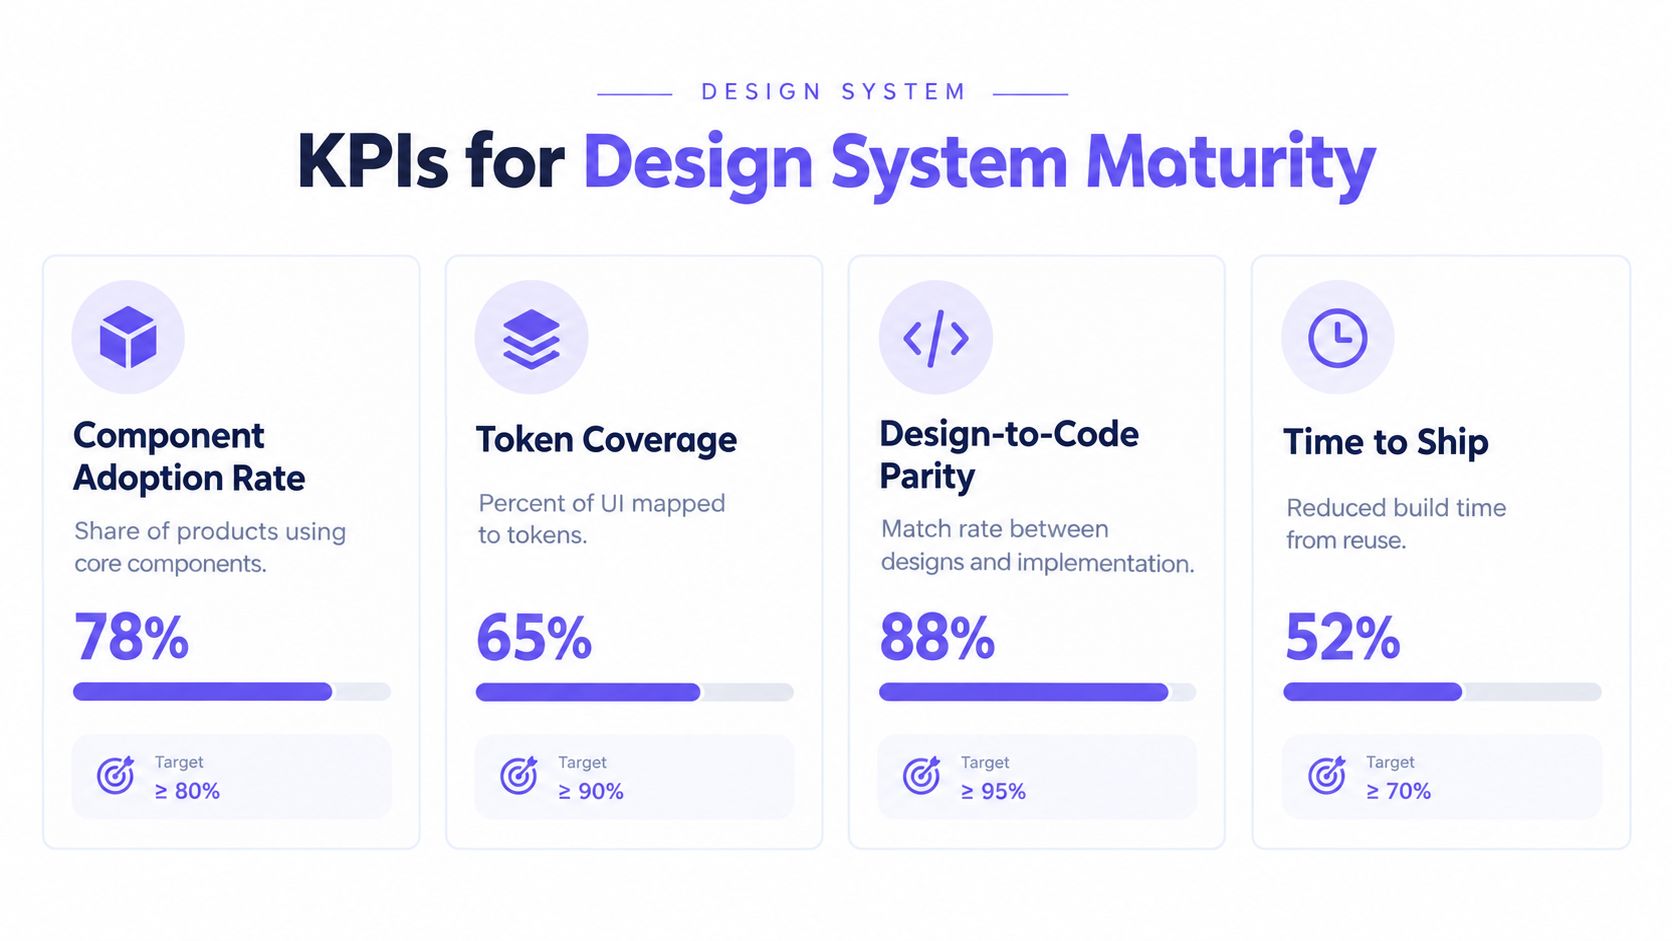
The most useful KPIs show whether the system changes delivery behavior and product quality. Catalog size is an input. Adoption, reuse, state coverage, accessibility, parity, and rework show whether the input matters.
Build formulas around observable work
Track each metric by product area, team, and workflow type. A healthy aggregate can conceal a critical surface where teams bypass the system.
- Component adoption rate:
production screens using approved components ÷ total production screens reviewed × 100
Define the screen sample and approved component set before comparing periods. - Token coverage:
relevant interface values mapped to approved tokens ÷ relevant interface values inspected × 100
Include color, typography, spacing, sizing, and other token categories that matter to your system. - Component reuse:
instances of approved components ÷ total instances serving the same interaction purpose × 100
Review duplicate components separately. A high reuse rate can still hide one overgrown component with unclear variants. - Documentation completeness:
components meeting required documentation fields ÷ components in scope × 100
Required fields might include purpose, anatomy, states, content guidance, accessibility notes, status, and code reference. - State coverage:
supported and documented states ÷ states required by the workflow × 100
Inspect empty, loading, error, disabled, success, validation, permission, and responsive states where relevant. - Accessibility issue density:
accessibility issues found ÷ screens, components, or flows reviewed
Choose one denominator for a reporting period, then segment findings by severity and component. - Design-code parity:
design decisions matching implementation ÷ design decisions inspected × 100
Compare names, token values, component variants, responsive behavior, and interaction states. - Handoff rework:
handoff-related revision time ÷ total delivery time × 100
Record the cause of each revision. Missing states, unclear behavior, and incorrect component selection point to different fixes.
Research cited in the empirical design-system study reports faster frontend cycles, lower UI defect density, and improved collaboration among organizations using design systems, while also reporting that designers supported by a relevant system completed tasks 34% faster than those without one, as described in the published study. Use that finding as a reason to measure delivery, not as a promise for your team.
The point of proving design system ROI is to connect system indicators with rework, experiment delivery, funnel behavior, and product consistency. Review the metrics quarterly or after a major release, reorganization, or budget change. A KPI that nobody uses to make a decision is reporting theater.
How to Move Through the Maturity Levels
Teams advance when they fix the weakest operating capability before buying more tooling. Each transition needs an owner, a visible behavior change, and evidence that the new practice works in shipped product work.
Treat each transition as a contract
Ad Hoc to Emerging. A Design Lead and senior engineer should inventory repeated patterns, agree on foundational tokens, and publish a small shared library. The deliverable is a usable starting set with naming rules and ownership. Measure whether target teams can find and use the agreed patterns. Don't expand the catalog before the first set works.
Emerging to Defined. The design-system manager, design representatives, and engineering representatives document component anatomy, states, variants, constraints, and usage guidance. Assign a decision owner and create a contribution path. A common mistake is documenting happy-path visuals while leaving loading, error, permission, and responsive behavior undefined.
Defined to Managed. Product teams, accessibility specialists, and engineering owners establish adoption reporting, accessibility checks, release controls, and design-code references. Segment usage by team and product area. The priority is removing friction, not enforcing compliance through approval queues that make the system slower than local work.
Managed to Optimized. Design-system leaders connect release feedback, production usage, defects, and product outcomes. They improve the information layer so designers, engineers, and AI tools can interpret tokens, components, and rules in context. Scaling contribution without clear quality gates creates more maintenance work than value.
A system earns its next level when teams behave differently, not when the repository gains another folder.
The governance mechanics described in Figr on design system governance are useful here, but governance should fit the organization. A small team may need a named owner and lightweight review. A multi-product organization may need release notes, contribution templates, compatibility rules, and escalation paths.
Assign responsibility before adding process
The Product Manager protects capacity and ties system work to product priorities. The Design Lead defines interaction quality and pattern intent. Engineers maintain implementation quality and integration paths. Accessibility specialists validate inclusive behavior. The system owner coordinates decisions and keeps the roadmap visible.
The zoom-out matters. Teams bypass systems when local delivery is rewarded while contribution work is invisible. Mature organizations make the shared work legible, fund maintenance, and measure whether the system lowers repeated effort. People follow the path that helps them ship with the least uncertainty.
Why Design Systems Fail to Mature
Design systems stall when ownership, product reality, and contribution workflows drift apart. Poor adoption is usually a symptom to investigate, not a character flaw in product teams.

The failure patterns are operational
Fragmented ownership creates contradictory decisions. One person maintains Figma, another controls the code package, and neither owns the contract between them. Name a cross-functional owner and publish decision rights.
Outdated libraries make the official path less useful than local invention. Establish component status, release notes, deprecation guidance, and a feedback channel. A stale component is a trust problem.
Undocumented variants force teams to infer behavior from screenshots. Document when a variant exists, when it shouldn't be used, and which states belong to the component. Engineers need equivalent information in the implementation.
Inconsistent product states expose the system's shallowest assumptions. Teams often design the default state first and improvise empty, loading, error, disabled, and permission states later. Audit complete flows, not isolated components.
Disconnected engineering workflows break design-code consistency. If tokens have different names, components diverge, and release timing is unclear, engineers create local wrappers. Create shared references and inspect parity during delivery rather than at the end.
The 2021 Sparkbox survey found that 52% of agency respondents identified lack of adoption as one of the most common reasons their clients' design systems were unsuccessful, according to the Design Systems Survey. Treat that figure as a warning about launch-oriented thinking. Adoption needs onboarding, support, missing-pattern discovery, and contribution routes.
Fix the cause beneath the bypass
Ask a team that bypassed the system what blocked them. The answer may be a missing component, unclear documentation, slow review, inaccessible defaults, poor code discoverability, or a requirement the system doesn't support. Record the reason, then prioritize repeated causes.
The 2025 Design Systems Report found that only 10% of respondents reported full adoption across all teams, while design-token adoption rose from 56% to 84% year over year, as reported in the survey release. Infrastructure can spread faster than trust. That is why governance, maintenance, and collaboration with non-designers deserve the same attention as components.
How AI Changes Design System Maturity
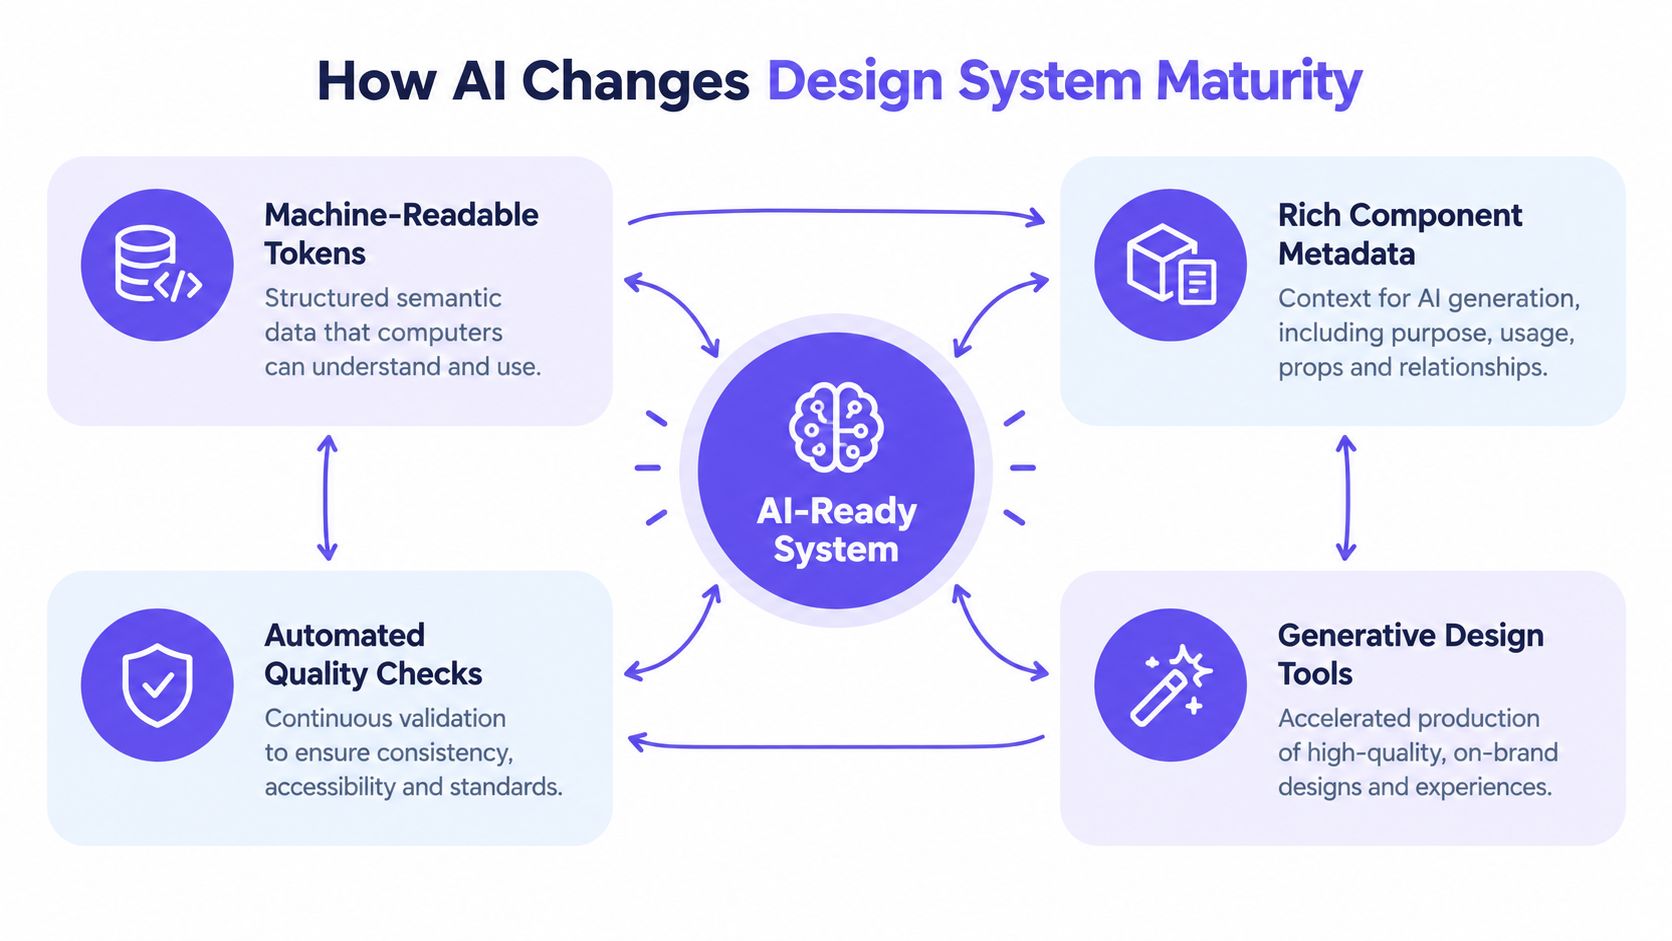
AI-ready maturity means product and design knowledge is structured well enough for an AI tool to retrieve, interpret, and apply it with human review. It requires more than connecting a model to a Figma file.
Context is the missing maturity layer
Machine-readable tokens provide semantic values rather than isolated color names. Rich component metadata explains anatomy, states, constraints, accessibility expectations, and intended use. Usage guidelines explain choices, while product context clarifies the user, workflow, business rule, and implementation boundary.
The five layers of a useful Visual Context Graph are:
- Visual: Screens show the existing interface and its visual language.
- Behavioral: Flows describe interaction sequences, states, and transitions.
- Design System: Tokens, components, variants, and usage rules describe reusable decisions.
- Product Knowledge: PRDs, research, requirements, and decisions explain why the experience works that way.
- Implementation: Code constraints reveal what can ship, how it behaves, and where integration risks sit.
This changes the maturity test. Can an AI agent identify the correct component for a permissioned empty state, understand why that component applies, preserve the token relationship, and respect an engineering constraint? If it only sees a screenshot, it may imitate appearance while missing behavior.
Access is not judgment
MCP can let supported development workflows access structured design information. It doesn't decide whether a component is appropriate, whether an interaction is accessible, or whether a product requirement justifies an exception. Human owners still govern the system, and accessibility validation remains necessary.
Teams preparing for this shift should read this guide to AI design agents, then improve the underlying knowledge before automating more output. The useful sequence is explicit metadata, reliable documentation, accessible component behavior, connected product context, and only then broader generation.
AI can make weak systems fail faster. If guidelines are ambiguous, metadata is stale, and variants are undocumented, generated work will reproduce those gaps at scale. Readiness is therefore a documentation and governance discipline before it becomes a tooling decision.
How Figr Supports Design System Maturity
Figr is an AI product design agent that grounds exploration and iteration in existing product and design-system context. Its Design System Intelligence uses tokens, components, variants, states, and usage rules when generating designs. That can support the Defined, Managed, and Optimized levels, but it doesn't replace system ownership, governance, or accessibility validation.
Connect the work teams already have
Figr's Context Pod can retain relevant product context across work. Custom Skills can encode repeatable team guidance. Multi-state prototypes help teams explore beyond the default screen, while Direct Editing uses design-system values during iteration. Figma Sync supports moving work into Figma, and Figr MCP provides supported development workflows with access to design information through the documented integration.
Those capabilities map to specific maturity gaps:
- Documentation and AI readiness: component usage guidelines and structured context make design intent easier to retrieve.
- State coverage: multi-state prototypes help teams inspect flows beyond the happy path.
- Design-code consistency: Figma Sync and MCP can connect design information with supported development workflows.
- Adoption: working within existing patterns reduces the distance between the official system and exploration.
- Product context: the Context Pod and connected knowledge help relate interface decisions to requirements and research.
A Design Lead still decides which patterns belong in the system. An engineer still validates implementation constraints. An accessibility specialist still tests the experience with the required tools and assistive technologies. Figr can help teams explore within known constraints, but it can't guarantee correct component selection, perfect adherence, automatic compliance, or complete edge-case detection.
The distinction matters for Product Managers. AI should reduce the cost of investigating alternatives and documenting decisions, while the design-system team remains accountable for the rules, releases, exceptions, and outcomes. A faster route to an ungoverned pattern is still a maturity regression.
A 90-Day Design System Maturity Improvement Roadmap
A focused 90-day roadmap works when each phase produces evidence for the next. Keep the scope narrow enough to inspect real product work, then use what you learn to expand responsibly.
Days 1 to 30 establish the baseline
Owner: Design-system manager with a Design Lead, engineer, accessibility representative, and Product Manager.
Deliverables:
- Score the eight dimensions from 0 to 4.
- Inventory core components, tokens, variants, states, documentation, and code references.
- Select representative product areas and record adoption, token coverage, parity, accessibility findings, and handoff rework.
- Interview teams that use the system and teams that bypass it.
Success criteria: Every score has evidence, every selected component has a known status, and bypass reasons are recorded by category. Don't set arbitrary improvement percentages. Establish a reproducible baseline and a clear list of high-risk gaps.
Days 31 to 60 fix the highest-friction gaps
Owner: Design-system contributors, component engineers, accessibility specialists, and documentation owners.
Deliverables:
- Repair the components and states most often bypassed.
- Align semantic tokens across design assets and code.
- Add usage guidance, constraints, accessibility notes, and status information.
- Define contribution, review, release, and deprecation workflows.
- Publish a short change log and hold working sessions with product teams.
Success criteria: The selected components have documented states and code references, contributors can follow the review path without private instructions, and the baseline metrics can be collected again using the same definitions.
Days 61 to 90 validate behavior in shipped work
Owner: Product teams, engineering leads, and the system owner.
Deliverables:
- Review production usage by product area and team.
- Compare design decisions with implementation for sampled flows.
- Recheck accessibility findings and handoff-related revisions.
- Review release engagement, exceptions, contribution activity, and missing-pattern requests.
- Decide which gap enters the next quarter's roadmap.
Success criteria: The team can show where adoption improved, where parity remains weak, which accessibility issues still need ownership, and whether rework causes changed. A useful review ends with fewer unknowns and a named next decision.
Start with the product area that causes the most repeated work, not the area with the most attractive components. Use Figr to explore and iterate with existing product and design-system context, then validate the resulting decisions through your team's governance and accessibility practices.
Conclusion
A mature design system is an operating capability supported by components, tokens, documentation, governance, adoption, accessibility, and design-code alignment. The library is only the visible surface.
Measure behavior in production, segment results by team and product area, and let weak dimensions guide investment. A high average can hide the exact bottleneck that keeps teams inventing around the system.
Choose one workflow, establish a baseline, repair its highest-friction gap, and review the evidence after 90 days. When you're ready to explore product work inside existing context, try Figr.
FAQ
What are the five levels of design system maturity?
The illustrative five levels are Ad Hoc, Emerging, Defined, Managed, and Optimized. They progress from inconsistent local patterns to governed, measurable, cross-product, continuously improving work with AI-ready context.
How do you assess design system maturity?
Score tokens, components, documentation, governance, adoption, accessibility, design-code consistency, and AI readiness from 0 to 4, for a total of 32 points. Use evidence and inspect weak individual dimensions rather than relying on the average.
What metrics measure design system maturity?
Useful metrics include component adoption, token coverage, component reuse, documentation completeness, state coverage, accessibility issue density, design-code parity, and handoff rework. Define each formula consistently and segment results by product area and team.
How do you improve a design system's maturity?
Fix the weakest capability first. Establish ownership, document patterns and states, align tokens with code, create contribution and release workflows, measure adoption, and validate accessibility in real product work.
How does AI affect design system maturity?
AI increases the value of machine-readable tokens, component metadata, usage guidance, product context, and connected design-to-code workflows. MCP can provide access to design information in supported workflows, but human governance and accessibility validation remain necessary.
Verified sources: Design Research Society paper on maturity models, Google State of Design Systems survey, Nielsen Norman Group maturity framework, empirical design-system study, Supernova critique of maturity models, 2025 Design Systems Report, Atomize maturity model, Sparkbox maturity model, Sparkbox Design Systems Survey, Figr Design System Intelligence, Figr changelog, Figr MCP documentation.