
With workflows optimized for adoption, we needed to prove that the system was making a real impact.
Leadership won’t continue funding a design system unless it drives tangible business results.
"Design is not just what it looks like and feels like. Design is how it works." — Steve Jobs
In our last blog, we explored how to embed the design system into daily workflows, making it the default choice for designers and developers. We tackled the challenges of ensuring that the system was not just an afterthought but an integral part of the creative process, ultimately leading to growing adoption.
Now, in Part 3, we turn our attention to a crucial question: How do we measure and prove the impact of your design system? With workflows optimized for adoption, it’s time to demonstrate the design system's value by tracking component usage and establishing design system KPIs. But what exactly should we be measuring? Is it enough to simply count how many times components are used, or do we need to dig deeper? How can we show leadership that our design system is not just a nice-to-have, but a critical asset that drives real business results? Let’s dive into how we can turn adoption into measurable results that resonate with leadership and stakeholders alike. Let’s find out!
If you're just jumping in, Part 1 of this series touches on why design systems often struggle to get adopted. Do give it a read to understand the common challenges and how to tackle them.
How do we measure real adoption beyond tracking component usage?
- Establish Design System KPIs:
Begin by defining specific design system KPIs that complement the objectives of your company. These KPIs should contain indicators like customer satisfaction ratings, consistency across products, and time saved in design and development, in addition to component utilization. An important sign of the design system's worth would be if it, for instance, reduced the time required to construct a new feature by 30%-50%.
- Track Component Usage in Context:
Instead of just counting how many times a component is used, it’s essential to analyze the context in which it’s utilized. Are designers consistently opting for system components in high-visibility projects? Are developers effectively integrating these components into their codebases? Understanding this context can provide valuable insights into how well the design system is being adopted and its overall impact on project success.
This is where Figr Nexus, the ultimate design system audit plugin, comes into play. This powerful tool thoroughly reviews your Figma files, catching even the tiniest mistakes; whether it’s inconsistencies in colors, typography, spacing, radius, or stroke. It generates a detailed Design Health Report that allows you to quickly identify and fix issues before they snowball. Acting as a Figma File Roaster, Figr Nexus provides a clear web report, giving you the insights needed to spot and resolve problems faster. By leveraging tools like this, teams can streamline their design process, maintain the integrity of their design systems, and ensure consistency across every screen—ultimately enhancing the efficiency and effectiveness of the entire design workflow.

- Gather User Feedback:
Collecting feedback from both designers and end-users is essential to assess the effectiveness of the design system. Surveys and interviews can provide valuable insights into how the system is perceived and whether it meets the needs of the team. This qualitative data complements your quantitative metrics, offering a more comprehensive view of the design system’s impact.
To gather meaningful feedback, consider asking questions such as:
- How does using the current system compare to what you had before?
This helps identify improvements or shortcomings in the new design system relative to previous tools or processes. - How easy is it for new hires to onboard and get started with the system?
Understanding the onboarding experience can highlight areas where the design system may need better documentation or support to facilitate smoother integration for newcomers. - Are there any specific families of components that feel redundant or need more improvements?
This feedback can pinpoint areas within the design system that require refinement or additional resources, ensuring that the system remains relevant and effective for users.
By addressing these questions, you can gather actionable insights that will help enhance the design system and ensure it continues to meet the evolving needs of your team. Zeroheight has released a template that you may use to create your own questions that represent your team and organization.
- Monitor Project Outcomes:
Compare and contrast the results of projects that used the design system with those that didn't. Examine variations in overall satisfaction, mistake rates, and user engagement. A good evidence of the design system's value is if projects that use it routinely perform better than others.
This comprehensive approach not only highlights the benefits of the design system but also reinforces its importance as a critical asset in your organization’s design and development processes.
In a recent reflection on the design system at Badoo, named Cosmos, Cristiano Rastelli noted its increasing popularity, with team members joking that any problem could be solved by opening a ticket for it. However, he recognized the difficulty in measuring its true impact, stating, "using only metrics to make decisions without using our brain, our heart, and sometimes even our gut, can be a double-edged sword." To quantify progress, he created an inventory of UI elements, assigning statuses and effort metrics to each component. By developing a weighted formula to compare the total effort required against the status of the components, he generated two numbers one optimistic and one pessimistic reflecting the design system's effectiveness.
What business metrics does a design system improve?
When it comes to the implementation of a design system (DS), we often find ourselves navigating a complex technical universe. However, the real magic happens when we shift our focus to the art of negotiating and managing stakeholders.
Consider these important metrics:
- Technical and Design Debt Improvement: Monitor the design system's ongoing reduction of technical and design debt, which results in a codebase that is easier to manage.
- Cost Improvement: Measure how much cost improvement is achieved through streamlined processes and reduced redundancy.
- Time to Cost Improvement: Evaluate efficiency measures by comparing the time taken to complete tasks before and after implementing the design system.
- Onboarding Cost: Assess the reduction in onboarding costs for new team members as they adapt to a standardized design system.
- Technical Innovation: Monitor how the design system fosters technical innovation, allowing engineering teams to focus on optimization and enhancing overall product performance.
By focusing on these metrics, you can effectively demonstrate the comprehensive impact of your design system, ensuring it is recognized as a valuable asset within the organization.
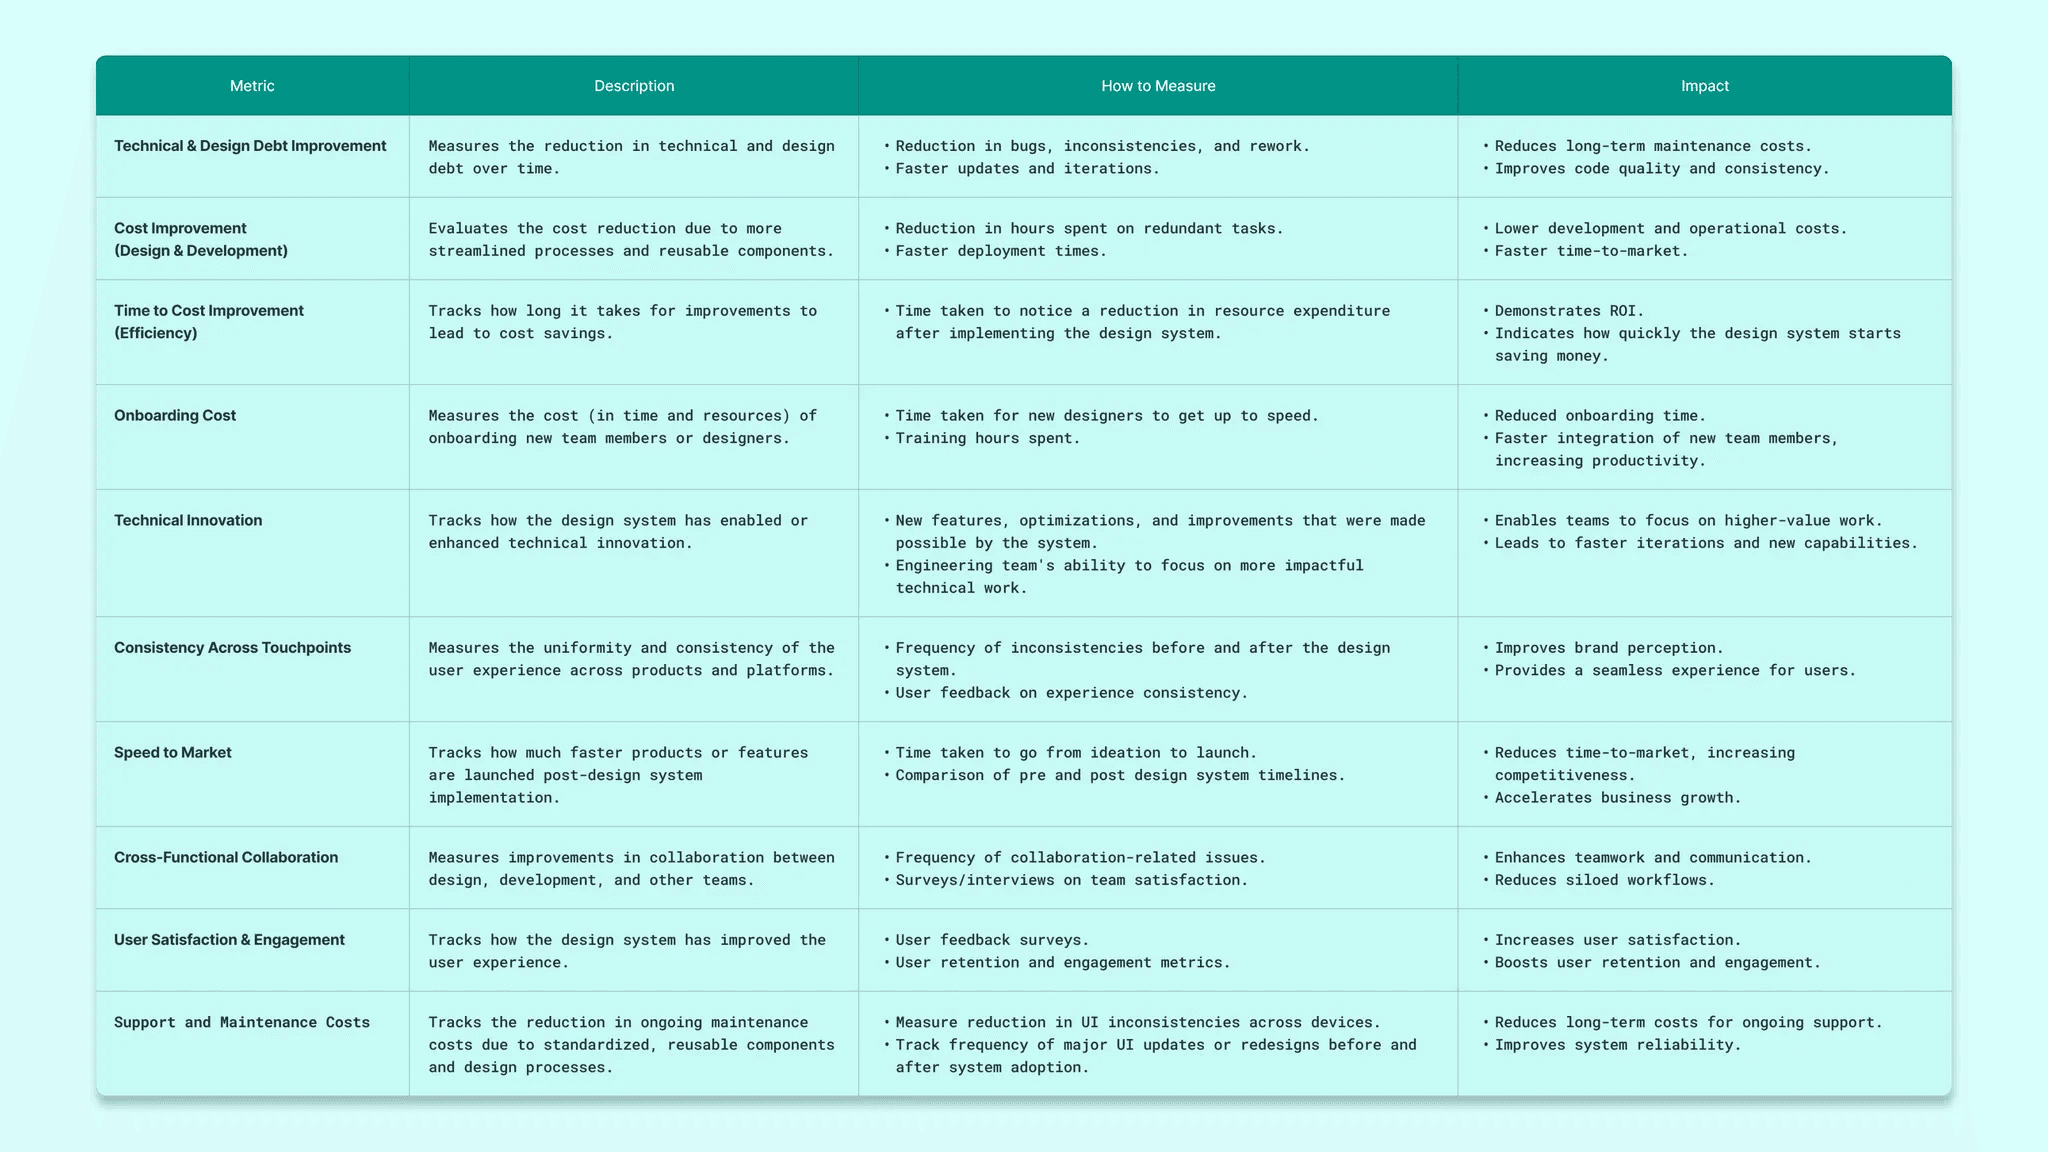
Here's a list of additional metrics along with some real life examples:
Metric
Description
How to Measure
Real-Life Example
Technical & Design Debt Improvement
Measures the reduction in technical and design debt over time.
- Reduction in bugs, inconsistencies, and rework.
- Faster updates and iterations.
Airbnb: By adopting a unified design system, Airbnb reduced design debt significantly and improved code reusability, enabling faster updates and less friction between teams.
Cost Improvement (Design & Development)
Evaluates the cost reduction due to more streamlined processes and reusable components.
- Reduction in hours spent on redundant tasks.
- Faster deployment times.
Spotify: Spotify's design system enabled the reuse of design elements across its platform, reducing the need to create new components from scratch for every feature, lowering design and development costs.
Time to Cost Improvement (Efficiency)
Tracks how long it takes for improvements to lead to cost savings.
- Time taken to notice a reduction in resource expenditure after implementing the design system.
Uber: After implementing a design system, Uber saw faster design iterations and quicker development cycles, leading to a 30% reduction in the time spent on design and engineering tasks.
Onboarding Cost
Measures the cost (in time and resources) of onboarding new team members or designers.
- Time taken for new designers to get up to speed.
- Training hours spent.
Atlassian: With a well-documented design system, Atlassian reduced the onboarding time for new designers by 40%, as they could quickly access reusable components and design guidelines.
Technical Innovation
Tracks how the design system has enabled or enhanced technical innovation.
- New features, optimizations, and improvements that were made possible by the system.
- Engineering team's ability to focus on more impactful technical work.
Google: With its Material Design system, Google was able to introduce innovative features like dark mode across its ecosystem of apps. The system allowed engineers to focus on more strategic innovations rather than repetitive design tasks.
Consistency Across Touchpoints
Measures the uniformity in user experience across various platforms and devices, ensuring a cohesive brand identity and reducing the need for frequent, inconsistent changes.
- Frequency of inconsistencies before and after the design system.
- User feedback on experience consistency.
IBM: IBM’s Carbon Design System helped ensure a consistent user experience across its suite of products, which was particularly valuable in maintaining a cohesive brand identity across multiple platforms.
Speed to Market
Tracks how much faster products or features are launched post-design system implementation.
- Time taken to go from ideation to launch.
- Comparison of pre and post design system timelines.
Salesforce: After implementing a robust design system, Salesforce significantly shortened its time-to-market, enabling faster rollouts of features across its cloud-based products.
Cross-Functional Collaboration
Measures improvements in collaboration between design, development, and other teams.
- Frequency of collaboration-related issues.
- Surveys/interviews on team satisfaction.
Microsoft: With the Fluent Design System, Microsoft saw a boost in collaboration across design, engineering, and product teams. This led to more efficient product development cycles.
User Satisfaction & Engagement
Tracks how the design system has improved the user experience.
- User feedback surveys.
- User retention and engagement metrics.
Apple: Apple’s Human Interface Guidelines ensure that all apps on its ecosystem maintain a high level of user satisfaction, leading to better engagement and higher user retention across iOS and macOS apps.
Support and Maintenance Costs
Tracks the reduction in ongoing maintenance costs due to standardized, reusable components and design processes.
- Measure the cost of ongoing updates and maintenance tasks.
- Track frequency of support-related issues pre and post design system.
With Spectrum Design, Adobe reported a 20% reduction in support and maintenance costs due to fewer inconsistencies and a streamlined process for design updates.
By tracking metrics, you can:
- Monitor Your Progress: See how far you’ve come and identify areas where you need to improve.
- Uncover Hidden Issues: Spot bottlenecks, inefficiencies, or components that are not being used, so you can address them before they become larger problems.
- Showcase ROI: Demonstrate the value your design system is bringing to the organization by quantifying its positive impact.
- Focus on Key Improvements: Make informed decisions about where to allocate resources and what features or components to prioritize next.
- Secure Stakeholder Support: When you have data to back up your decisions, you can more easily gain the resources and backing you need to continue developing your system.
The Key Strategies We Followed
- Built a Visual Coverage Analyzer to track real adoption across UI screens.
- Connected system adoption to efficiency metrics (development time saved, UI consistency improvements).
- Created a real-time adoption dashboard for tracking usage trends.
By demonstrating that adoption led to tangible business value, leadership became strong advocates for the system. However, adoption isn't a one-time achievement - it's an ongoing process that requires continuous effort and reinforcement.
Measurement is how you keep the system alive. For the full lifecycle - from laying foundations to scaling with AI - explore our design system best practices guide.
As we conclude this chapter, it's clear that maintaining momentum is just as crucial as the initial push. Stay tuned for Part 4, the final installment of this series, where we’ll explore how to sustain adoption over time. After all, much like a successful design system, our work must be regularly nurtured to keep delivering lasting impact.