

Customer insight platforms fail when teams buy them for the dashboard and hope the decision appears later. I've watched that pattern repeat in B2B SaaS, where support, product, and design all stare at the same data and still walk away with different conclusions.
When the signal stays fragmented, the cost shows up in slow roadmap calls, noisy prioritization, and designs that solve the wrong problem. A Product Manager sees churn. A Designer sees friction. Support sees confusion. No one has the full picture, so the team keeps revisiting the same debate in slightly different language.
The useful shift is to treat customer insights tools as decision systems, not storage systems. The right platform surfaces behavioral, attitudinal, and market signals in a way teams can act on, then connects that output to product and design work before the next cycle starts.
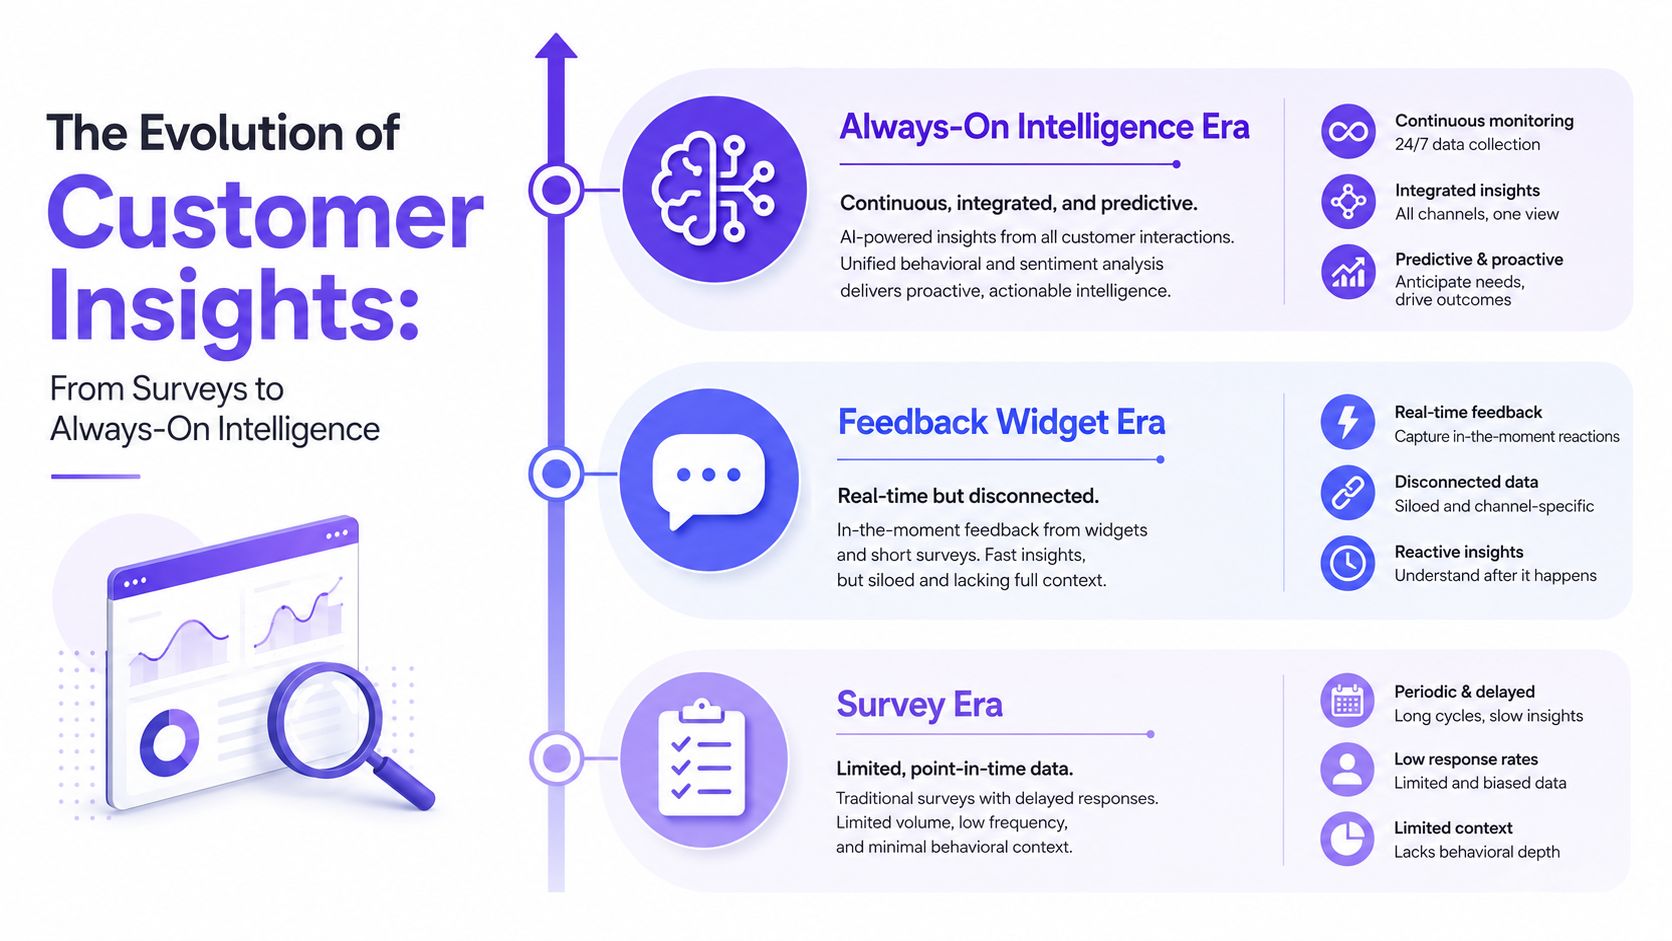
How Customer Insights Tools Evolved From Surveys to Always-On Intelligence
Customer insights tools changed from periodic listening posts into always-on operating systems. That shift matters because product teams no longer wait for a quarterly readout before they act, they need live evidence while the product cycle is still open.
From snapshot research to continuous signal
The old model was simple. Teams sent surveys, read the responses, and hoped the answer still applied by the time the roadmap meeting happened. Modern platforms pull from behavioral analytics, support channels, and social listening, which is why the category now looks more like an intelligence layer than a feedback inbox. GWI describes access to nearly 3 billion consumers across 53 countries, and Statista reports coverage across 80,000 topics, 170 industries, and 150 countries in the current market-research tooling sector, which shows how far the category has moved from local sampling to global, multi-source systems. That scale is also why Microsoft Dynamics 365 Customer Insights - Data and McKinsey's Customer Insights describe the outcome as a 360-degree view of the customer in practice (GWI).
Practical rule: if the platform only stores feedback, it is already behind the way your team works.
Why the shift changes product behavior
A Product Manager used to collect evidence, write a summary, and wait for the next review cycle. Now the better tools let teams spot a pattern, segment it, and test a response while the issue is still active. Mixpanel and Zendesk both frame customer analytics as real-time insights and continuous monitoring, not periodic reporting, and that changes the operating rhythm inside a product org (Mixpanel). The basic gist is this, continuous tools don't just describe the past, they shape what the team notices next.
That matters at scale because teams respond to what they can see quickly. If onboarding friction appears in behavior data on Monday and support tickets confirm the same confusion by Wednesday, the team has a narrow window to decide whether to rewrite copy, change the flow, or leave it alone. Insight tooling stops being a research archive and starts acting like a coordination layer between Product Manager, Designer, and support lead.

Choosing a Platform by the Decision You Need to Make
The right platform is the one that helps your team answer the question it cannot resolve today. Start with the decision, and the category gets clearer fast. Start with features, and teams usually buy more than they can use.
Name the decision before you name the tool
A friend at a Series C company once walked me through a six-tab comparison sheet for customer insight platforms. None of the tabs said what decision the team needed to make, so none of them were useful. The team eventually realized they needed to understand why trial users dropped before activation, not whether a platform could collect more signals.
That shift changes the buying process. If the question is about onboarding drop-off, the platform needs to surface behavioral friction and support context. If the question is about why a segment responds differently, it needs to help the team compare cohorts without turning every review into a spreadsheet exercise.
Here is a practical way to choose.
State the unresolved decision.
Write the exact question in plain English, like why users abandon onboarding or which segment treats the product differently.Match the decision to the signal type.
Behavioral questions fit product analytics. Preference and motivation questions fit voice-of-customer tools. Market movement questions often need social listening or survey data.Run the tool in the actual workflow.
Use it where the team already makes decisions, not in a sandbox. If the question gets sharper, keep going. If it does not, the tool is only producing more charts.Add another category only when the first one changes decisions.
Many teams do not need more data. They need a better route from signal to action.
That discipline is easy to miss in platform evaluations. A useful reference is benchmarks for scraping APIs, because it makes the same point from another angle, capabilities matter when they fit the job you are trying to do. For a broader framing on tool choice, the guide for product leaders on tool selection is useful because it compares tools by workflow, not just label.
What this prevents in practice
When teams skip this step, they buy a platform that is strong in one kind of signal and weak in the decision they need to make. The result is ritual reporting, where people admire the dashboard but keep arguing about the same roadmap call. If the goal is to know why enterprise deals stall, a feature-rich analytics suite will not help much if the blocker lives in support language or a missing workflow cue.
The fastest check is simple. If your team cannot name the decision in one sentence, you are not ready to buy. If you can, the shortlist gets shorter fast.
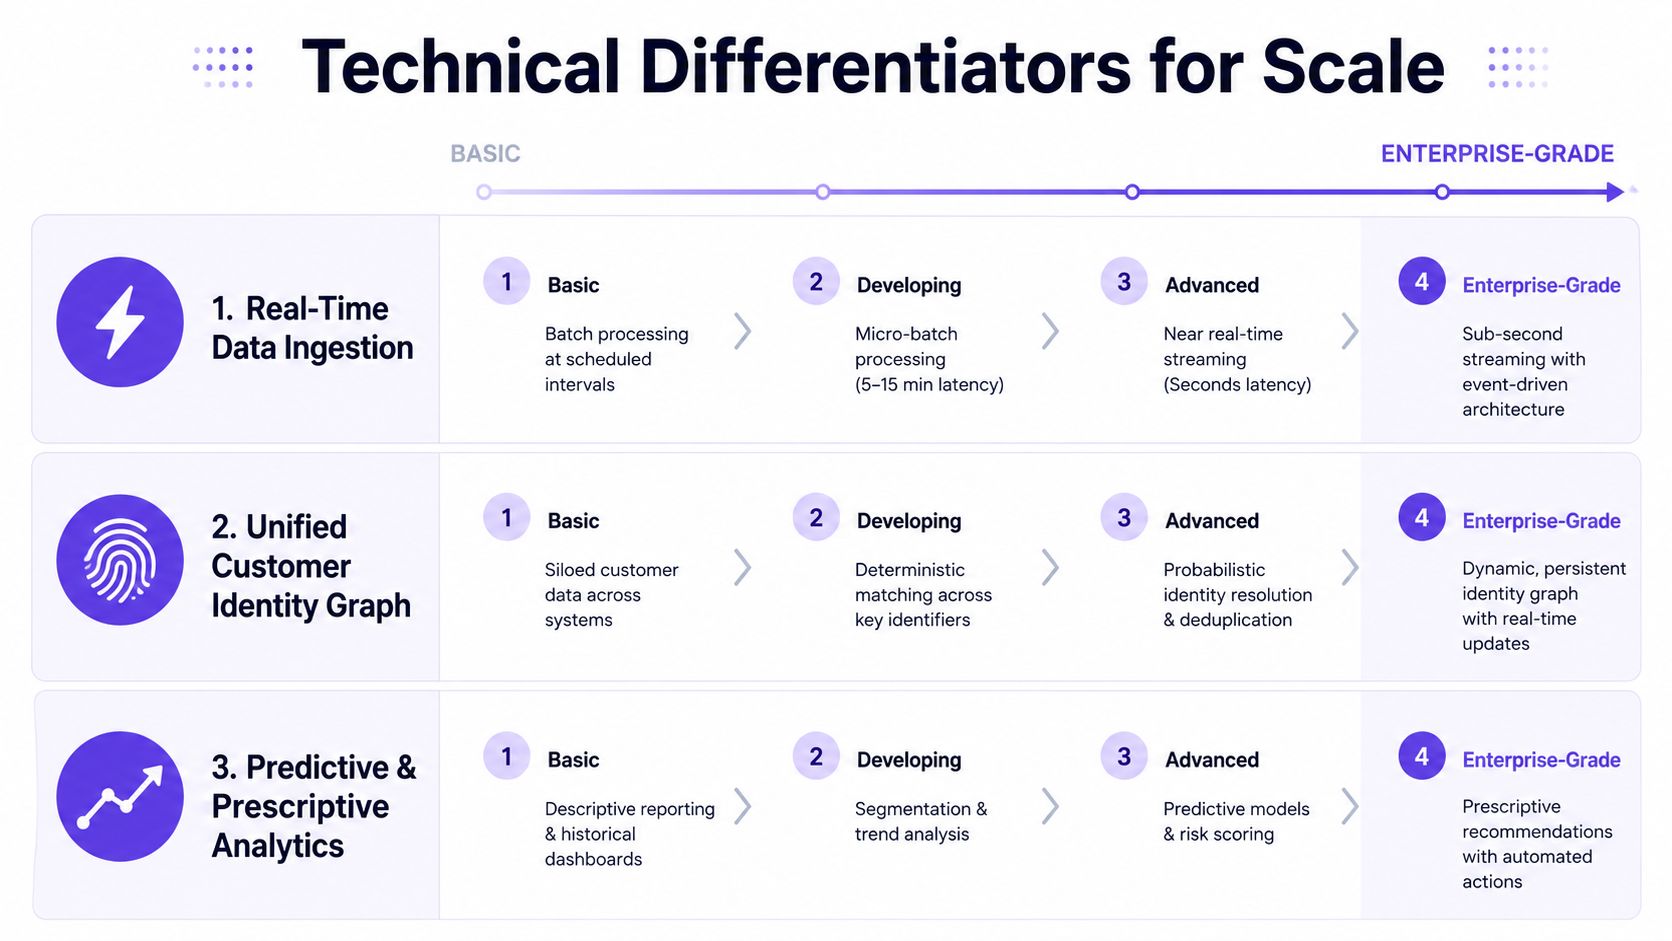
Technical Differentiators That Actually Matter at Scale
A platform can look polished in a demo and still break under real usage. At scale, the differences that matter are identity resolution, cross-channel stitching, and latency, because those determine whether teams can trust the output before the moment passes.
Identity resolution decides whether the view is real
Microsoft describes Dynamics 365 Customer Insights - Data as a customer data platform that builds a unified customer view, and its guidance explains that it removes duplicates and matches records across systems with AI-based fuzzy matching to create a single unified customer table (Microsoft overview). That matters because segmentation gets noisy when the same person shows up as three profiles across three systems.
I've seen this break product decisions in practice. A SaaS team may think three separate accounts are churning in one enterprise segment, when the same buyer is using a personal email in marketing, a work email in product telemetry, and a support alias in the help desk. The dashboard looks busy, the narrative sounds plausible, and the roadmap discussion goes in the wrong direction because nobody can tell which record is the customer.
If a platform cannot merge identities cleanly, every later insight gets weaker. Product teams end up debating whether a behavior belongs to one customer or three, which wastes time and makes design decisions harder to trust. For a practical way to pressure-test this before implementation, primary customer research methods can help teams compare what the platform sees against what users say and do.
If the identity layer is weak, the rest of the stack spends its time cleaning up confusion.
Cross-channel stitching and latency shape the workflow
Adobe says Customer Journey Analytics can turn billions of data points into customer-level insights in milliseconds and combines online and offline data with identity resolution and visual, AI-assisted exploration (Adobe). The technical claim matters less than the operational one. High-volume teams need the gap between a behavior appearing and a decision being made to stay short.
Architecture becomes part of the workflow. If the platform only works in batch mode, the team sees yesterday's friction after today's meeting is already over. If it can stitch channels and return queries quickly, a Designer can inspect a support pattern, a Product Manager can segment it, and both can respond while the issue is still active.
For teams evaluating vendors, a clean demo often hides the hard part. Ask how profiles merge, how offline interactions land in the same view, and how long a fresh segment takes to return. Those questions show whether the platform is built for reporting or for active decisioning.
The Hidden Problem of Geographic and Source Bias
More data does not automatically mean better insight. If the platform's strongest geography or channel doesn't match your customer base, the conclusions can be misleading even when the charts look polished.
Coverage bias changes what the platform thinks is true
Recent buyer guidance says teams should check the mix of first-party behavioral data, survey data, and third-party data, and verify whether the platform covers the markets they sell into (Guideflow). That matters because some tools are stronger in North America but weaker in APAC or EMEA, and those gaps don't always announce themselves until after the team acts on them.
The issue isn't just regional. Channel access shapes the result too. A platform that leans heavily on support tickets will overrepresent confused users. One that leans on product telemetry will miss sentiment and language nuance. The insight can still be useful, but only if the team knows what kind of bias is baked in.
Audit the source mix before you trust the output
A Product Manager should ask three things before committing:
Where does the data come from?
Behavioral logs, surveys, support, social, third-party panels, or a mix.Which markets are represented?
North America-heavy coverage can distort conclusions for global teams.What is missing by design?
Language coverage, channel access, and sampling gaps often matter more than raw volume.
The reason this matters is simple. Teams like to treat customer insight platforms as objective mirrors, but they're really shaped windows. If your market expansion depends on APAC behavior and the tool mostly reflects North American usage, your roadmap can drift before anyone notices.
For a useful contrast, primary customer research guidance helps teams think about source quality before they treat a signal as truth. That habit saves a lot of bad prioritization later.
What Makes an Insight Actually Actionable
A full dashboard can still leave a Product Manager stuck if it does not change the next decision.
The standard is higher than a chart
Stravito's framing is the one I keep coming back to, “Data informs. Observations describe. Insights explain.” It also says the work should start with a clear business question so the analysis does not drift into noise (Stravito). That discipline matters for product teams. If the signal does not point to a specific decision, it is still raw input.
Reveal sets a useful bar too. A true insight needs to be non-obvious, actionable, behavior-changing, and mutually beneficial for both the business and the customer (Reveal). That definition separates real decision material from patterns the team already suspected.
A usable insight changes a conversation
I watched a Product Manager bring a support theme into a roadmap review. The team had seen the issue before, but the difference was that the theme was tied to a specific behavior pattern and a clear user segment. The discussion shifted from “Should we look at this?” to “Which flow gets fixed first?”
That is the standard. A useful insight does more than confirm a hunch. It narrows the next action and gives analytics, support, and design a shared language. That matters when three teams all think they own the customer.
The Trendy piece on data-driven content tips is a reminder that raw metrics are easy to collect and hard to interpret. Product teams run into the same problem. A signal only matters when someone can use it to make a decision this week.
Figr works in that same gap between observation and action. As an AI design tool for product teams, it helps carry the context of the signal into the design workflow instead of letting it disappear after the meeting.
Bridging Customer Signals to Product Design with Figr
Customer insight tools tell you what changed. Design tools help you respond without losing the context that made the signal matter.
Turn insight output into design-ready context
Figr fits into this handoff when the customer signal already exists and the design team needs to act on it. If analytics show a drop-off in onboarding, I'd use analytics CSVs to bring that evidence into the workflow. If support themes keep repeating, I'd use brainstorm research to cluster the patterns before anyone redraws the flow.
Then the team can pass that context through product context, which gives the design work a memory of what was observed. That matters because the same signal often gets interpreted differently by different people. A Product Manager sees a funnel issue. A Designer sees a layout issue. The platform has to keep both in view long enough for a better decision to emerge.
A practical weekly workflow
Step 1. Import the signal.
Bring in analytics, support notes, or feedback exports.
Use the clearest source first.
Keep the original wording where possible.
Capture the user segment and journey stage.
Step 2. Cluster the pattern.
Group the repeated confusion, drop-off, or request.
Separate behavior from interpretation.
Mark what is confirmed and what is still a hypothesis.
Keep one problem statement per cluster.
Step 3. Generate the design response.
Use the context to draft targeted flow variants.
Focus on the exact friction point.
Preserve the current design system logic.
Produce Figma-ready output that the team can review and edit.
The gap between insight and execution usually opens. Figr closes that gap by keeping the customer signal attached to the design task instead of burying it in a slide deck. If you want to see the workflow in the product itself, the AI design tool for product teams shows how live context can shape the next screen without flattening the reasoning.
The useful question is not “What does the data say?” It is “What should the Designer make differently on Monday?”
The Visual Context Graph and Five Layers of Product Memory
Figr's Visual Context Graph is the reason customer signals don't get stripped of meaning on the way into design. It connects visual context, behavioral context, design system context, product knowledge context, and implementation context into one working memory.
How the layers keep a signal intact
A team at a B2B SaaS company can learn that users are dropping at a specific onboarding step, but the fix depends on more than the funnel chart. Visual context shows the current screen. Behavioral context brings in the analytics. Design system context knows which components and variants are already allowed. Product knowledge context carries the PRD, research notes, and prior decisions. Implementation context keeps the team honest about constraints and edge cases.
That layering is what keeps the output grounded. A generic AI design tool can produce something that looks plausible. Figr can produce something that fits the product reality the team already lives in. That difference shows up fast when a design has to survive review with engineering and still make sense to support.
Why product memory matters in real work
A memory-less workflow forces teams to re-explain the same issue every time a new artifact is generated. That wastes time and creates drift. The AI PM's secret weapon is really product memory, because once the system remembers the context across sessions, the next iteration starts closer to the problem.

The practical outcome is straightforward. Customer signals become design input, design input becomes a reviewable artifact, and the team spends less time translating between tools. For a Product Manager and Designer working together, that shared memory is often the difference between a fast iteration and a long loop of revisions.
A Decision-First Framework for Evaluating Customer Insights Tools
Start with the decision, not the feature list. If the platform doesn't help your team make a sharper call, the rest of the dashboard is decoration.
Use this filter in your next vendor review
Name the decision.
Write the exact product question you need answered.Check the source mix.
Make sure the platform reflects your customer geography and channels.Test the technical fit.
Identity resolution, stitching, and latency should match your usage patterns.Define actionable output.
Decide what insight is strong enough to change a roadmap or design choice.Connect it to execution.
Make sure the signal flows into the team that will ship the fix.
Choose tools that change behavior
When teams evaluate customer insights tools this way, the noise drops fast. The shortlist gets smaller, the discussions get clearer, and the platform has to earn its place by helping the team make better decisions. That's the true benchmark.
For teams that need the handoff from signal to screen to stay intact, research-to-PRD workflow support is a useful adjacent path because it keeps the insight connected to the artifact that gets built.
In short, buy for the decision, audit for the data you have, and verify that the output reaches design before it decays into a slide. That is how customer insight platforms stop being reporting tools and start becoming part of the product operating system.
If you're comparing customer insights tools right now, use the next vendor call to test decision fit, source coverage, and how quickly the platform turns signal into action. Figr helps product teams carry that signal into design work with live product context, analytics, and Figma-ready output, so the conversation doesn't stop at the dashboard. If you want to see how that works in practice, visit Figr.
FAQ
What is a customer insights tool?
It's a platform that collects and analyzes behavioral, attitudinal, and market signals in one place. I'd use it when I need customer evidence to shape product or design decisions.
How do I choose between customer insights tools?
Start with the decision you need to make, then match the tool to the signal type. If the platform doesn't improve the decision, it's the wrong fit.
What's the difference between customer insight platforms and UX research tools?
Customer insight platforms watch ongoing product and market signals. UX research tools are better for discrete studies and targeted questions, so I keep them separate in the stack.
How do I know if an insight is actionable?
It should be non-obvious, behavior-changing, and tied to a specific next step. If no one can act on it this week, it's probably just an observation.
Where does Figr fit in this workflow?
I'd use it after the signal is identified and before the design gets handed off. It keeps the customer context attached to the screen, which makes the response easier to review and ship.