

A product manager ships a checkout change on Monday. By Friday the conversion chart shows a lift, the growth lead mentions a promotion that started midweek, and the engineer says the flag only reached half the users. Three readings of one test, and no clear way to tell which one is true.
Fridays like that are expensive. Teams either ship on a number nobody can defend or kill a change that was working, and both outcomes teach people to trust instinct over evidence. A 2025 analysis of the A/B testing software market reports that 37% of companies struggle to interpret test results, tying the problem to statistical significance, sample-size errors, and false positives or negatives.
A/B testing tools get sold on feature counts. The split that matters more is where the test runs: in a visual editor on a marketing page, in code behind a feature flag, or inside an analytics workflow where the events already live. This guide sorts ten platforms by that decision, then covers what each does well, where each strains, and which team it fits. The category is crowded enough that nobody needs a longer list, with the global A/B testing tools market valued at USD 1.8 billion in 2025 according to DataIntelo.
1. Optimizely
Optimizely is what teams buy when an experimentation program has outgrown a single editor. The platform pairs a visual editor for page-level variants with Feature Experimentation, which runs SDK-based tests and flags in code. Marketing changes a headline on Tuesday; engineering tests a pricing rule on Thursday, in the same account.
Breadth earns its keep when volume is real. Analysis of 28,304 experiments found North American optimizers averaged 13.6 A/B experiments per month against 7.7 in Western Europe, a 77% difference, and A/B tests made up 97.5% of all experiments (growth experimentation statistics).
Where it strains
Pricing is packaged per product rather than published, so the number depends on the call you take. The surface area is wide too, and a team testing two landing pages still pays for governance, audience tooling, and rollout plumbing it may never open.
- Setup cost: Feature Experimentation assumes an SDK integration and a developer who owns it.
- Admin sprawl: Both halves of the product carry their own configuration overhead.
- Small programs: A six-test quarter rarely justifies the contract.
Who it fits
Organizations with separate marketing and product owners who need both under one contract. The discipline that makes that breadth pay off sits upstream: A/B testing best practices start with a written hypothesis and a primary metric, not with a variant idea.
2. VWO
Open the pricing page before the feature list. VWO sells named plans rather than one product, and what's included in the editor, targeting, and reporting shifts between them, so the plan comparison needs a line-by-line read before a demo.
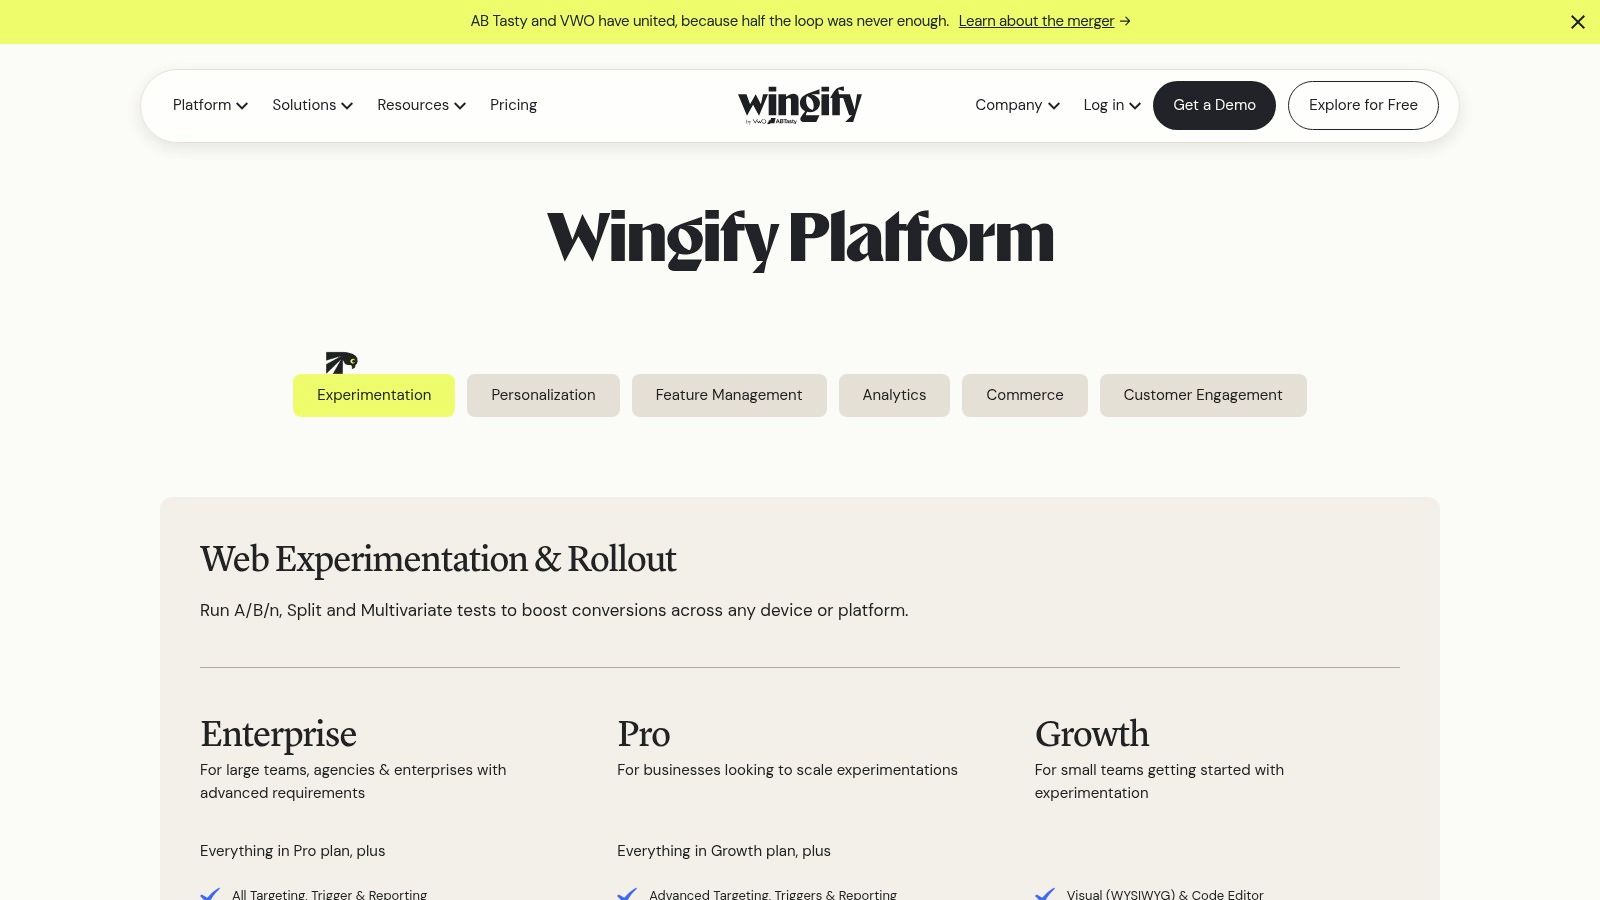
Underneath sits a real web experimentation platform: A/B, split URL, and multivariate tests, visual and code editors, plus feature experimentation for product changes. Behavior analytics, personalization, and voice-of-customer products live in the same suite, which is why it lands on shortlists in the first place.
The sample-size question
Work out whether your traffic can answer your question before you compare editors. The Nielsen Norman Group treats 95% statistical significance as the usual threshold and recommends running a test for at least one to two weeks, even when the required traffic arrives sooner, so normal swings in user behavior show up in the result. Run your numbers through a users per variant reference table before you commit, because a plan cap can decide the question for you.
Practical rule: If the lift you need is small and the traffic is thin, test a bigger change rather than a smaller one.
It fits marketing and product teams that want test tooling beside behavior analytics and will do the plan mapping before signing.
3. AB Tasty
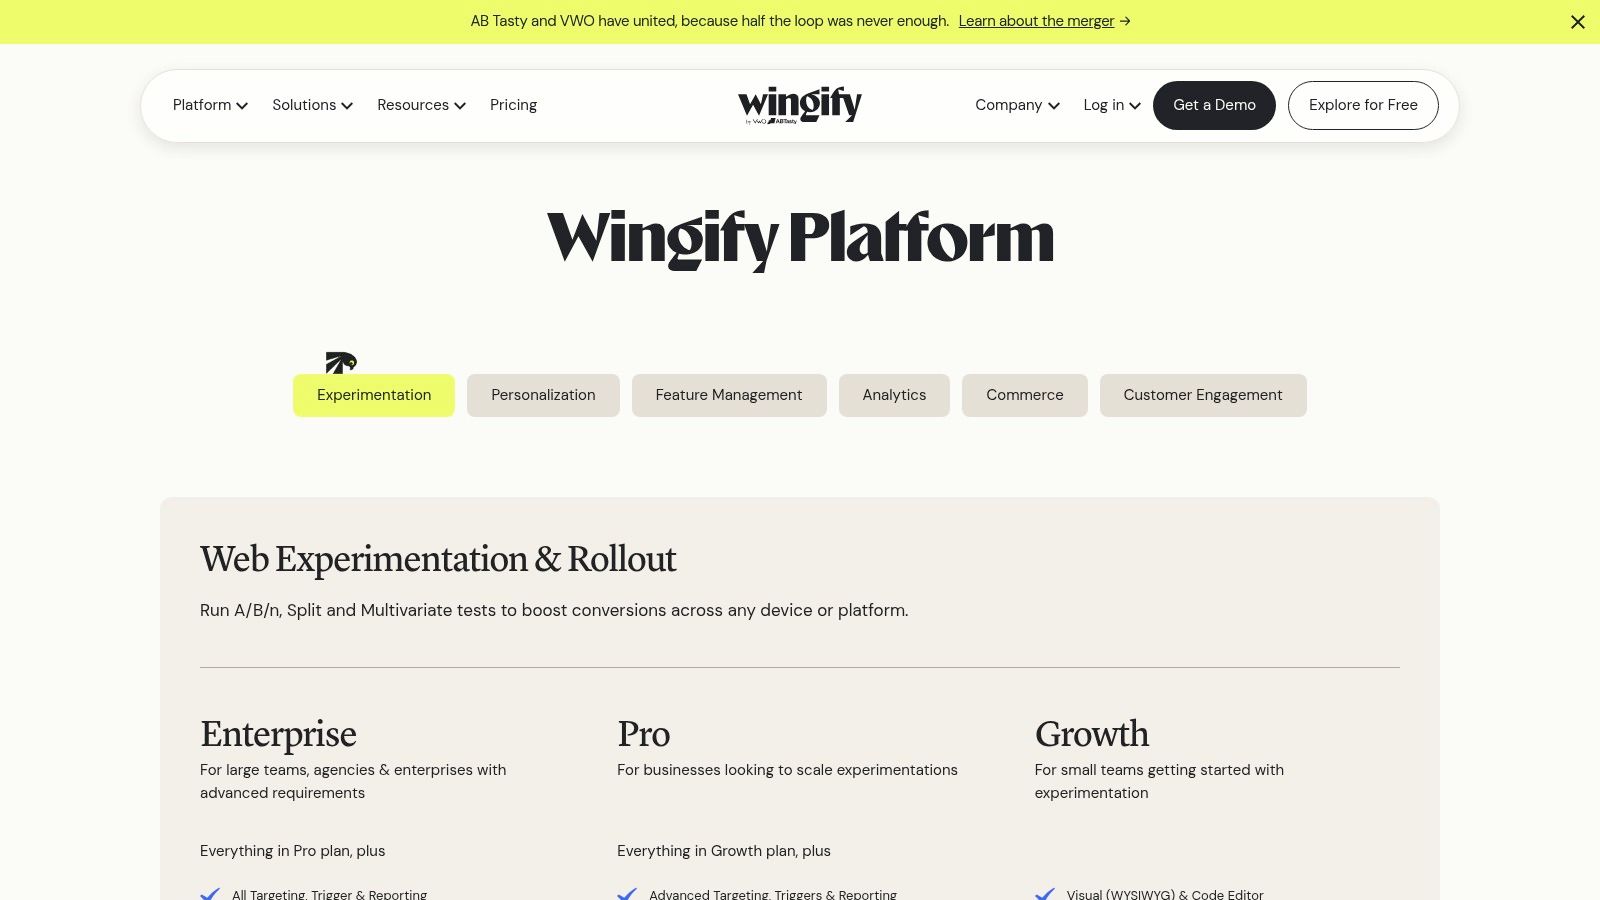
AB Tasty sells a supported relationship rather than a self-serve login. Quoted plans bundle onboarding, training, and ongoing support, which is why the AB Tasty pricing page publishes no fixed number and there's no free trial, though a proof of concept can sometimes be arranged.
That model tracks where the market has gone. Speero's Experimentation Maturity Program Report, summarized in a roundup of A/B testing statistics, found 54% of companies at strategic or advanced experimentation-maturity levels in 2025, up from 35% in 2021. More teams now want a vendor that has run this before.
What the platform covers
A/B/n, multivariate, split URL, and predictive testing, a visual editor with goal tracking and real-time reporting, and feature experimentation with rollout tools. Personalization, segmentation, and recommendations sit in the wider suite rather than the testing tab.
Where it strains
Cost scales with traffic, domains, modules, and implementation scope, so two companies with similar visitor numbers can receive very different quotes. Ask what counts as a tested user and what renewal looks like before the pilot ends.
Page-level work needs a plan behind it. Pair the test with conversion rate optimization techniques for 2026 so every variant traces back to a friction you can name, not a color you find tiring.
4. Statsig
Statsig's pitch is consolidation. Experiments, feature flags, product analytics, and session replay share one product, so a change can be read against the same events that produced the idea. For a team deciding between a visual editor, code behind flags, and an analytics workflow, Statsig sits in the middle: the flag and the measurement live in one place.
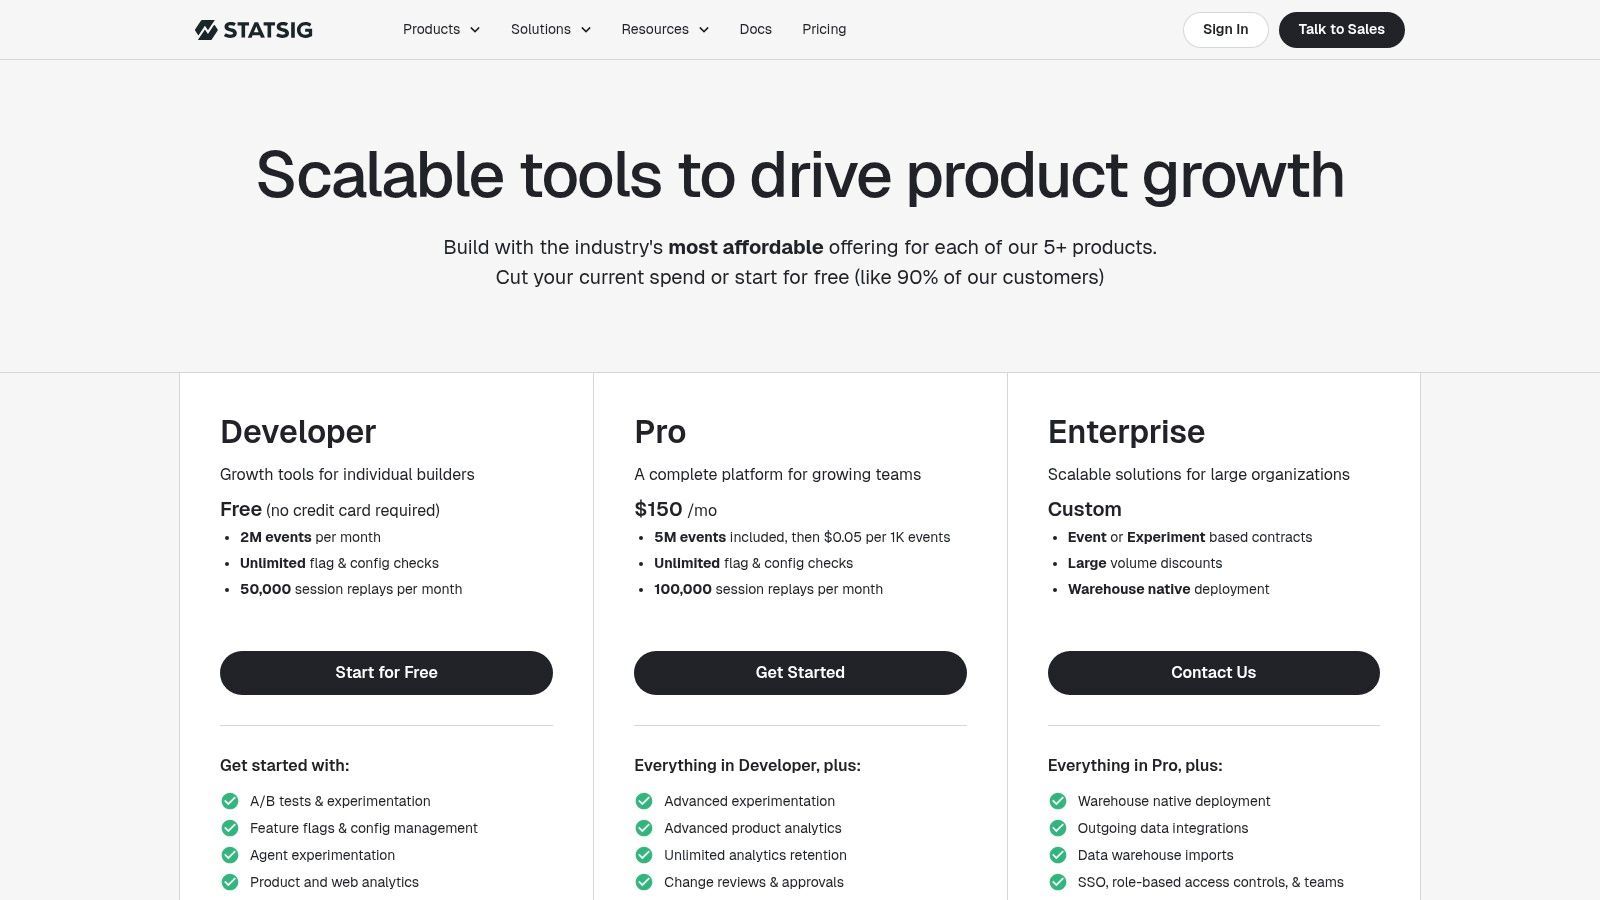
That shared workflow is where AI tools for experiment hypotheses earn a place. A generated hypothesis is only worth the trip to the flag if you can test it against metrics the platform already defines.
The math hasn't moved
A common design targets a 5% significance level, which is 95% confidence, together with 80% power. Adobe's guidance on determining sample size starts from the baseline conversion rate and daily traffic, then estimates the visitors needed to detect predefined lifts of 1%, 2%, 5%, 10%, 15%, or 20%. Catching a 1% lift can need many multiples of the traffic that catches a 10% lift, which turns usage-based billing into a statistics question as much as a finance one.
Where it strains
- Forecasting: Event-based billing moves with traffic spikes you don't control.
- No-code: Teams expecting a drag-and-drop page editor should test that workflow first.
- Metric setup: The experiment reads against events the platform already tracks, so the metrics layer needs defining before the flag ships.
Statsig's plan terms and billing units change over time, so estimate your event volume and project count, then check the current pricing page before committing. Add headroom for the spike a launch week brings, because that is when the overage shows up.
5. PostHog
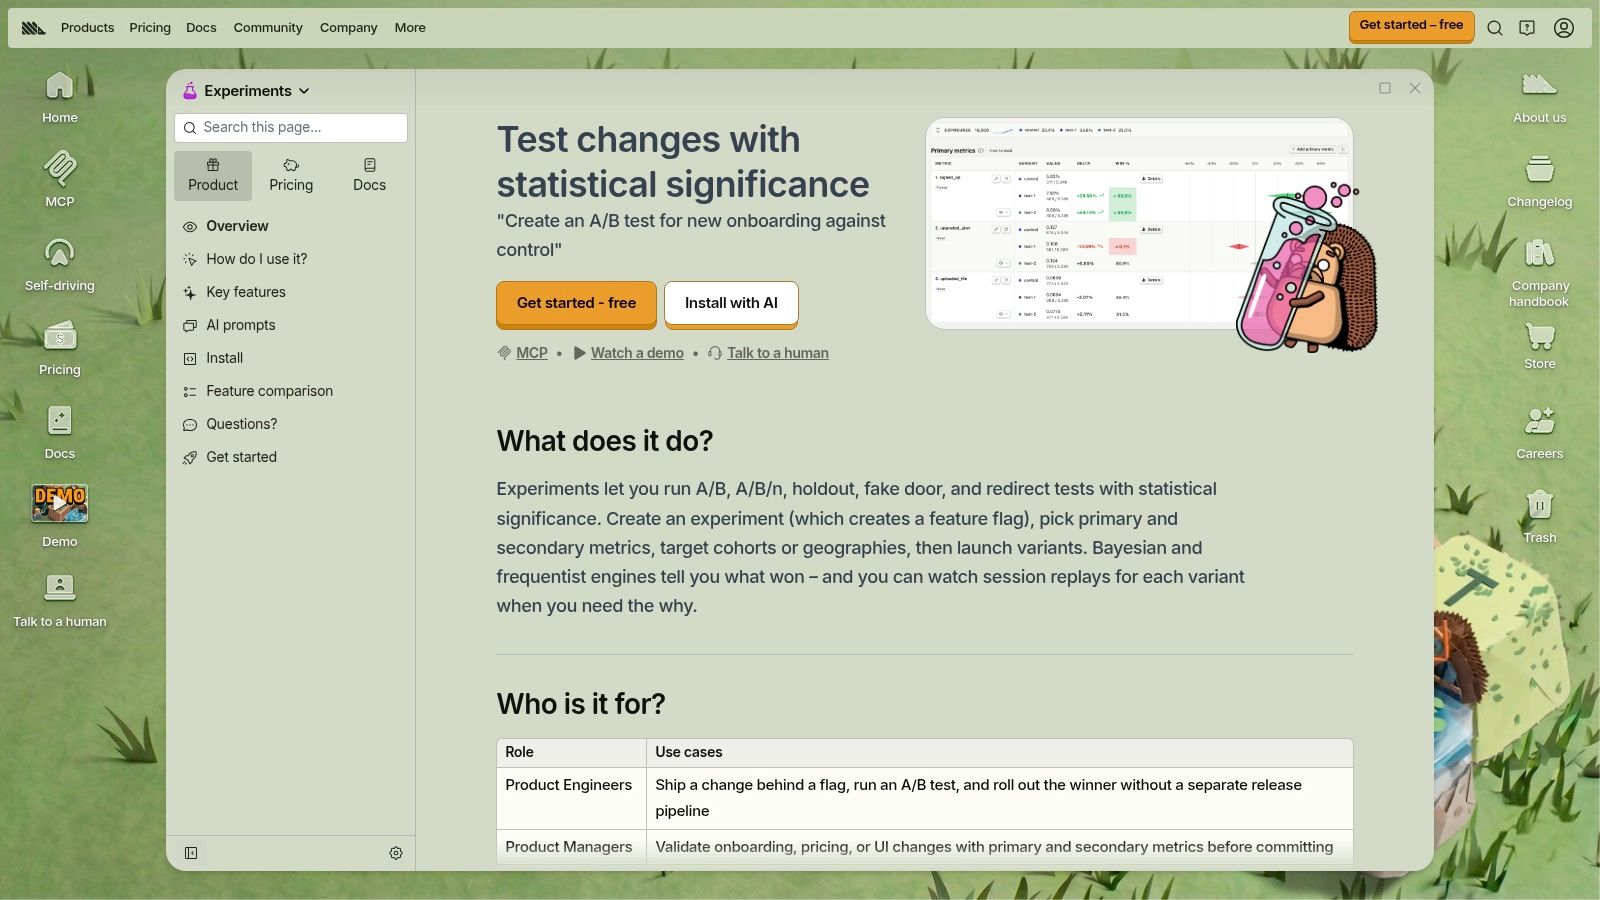
PostHog treats an experiment as a feature flag with measurement attached. Variants get built in code or in the product, and results are read through product metrics, funnels, or warehouse data, with session replays attached to each variant so you can watch what the difference looked like.
The value of that setup shows up in the checks that run before anyone declares a winner. Adobe's list of common A/B testing pitfalls recommends pinning the primary metric, baseline, minimum detectable effect, significance and power targets, audience rules, and stopping condition before exposure begins, then inspecting guardrail metrics such as errors, cancellations, latency, or downstream retention. A variant that lifts signups and dents week-four retention is a loss.
Where it strains
- Variants need a builder: A designer or engineer writes the implementation. This isn't a no-code page editor.
- Flag-based costs: Experiment spend is tied to feature-flag requests, so volume needs watching.
- Instrumentation debt: Teams on another analytics stack inherit the integration work.
Who it fits
Product teams asking about logged-in behavior: onboarding steps, funnel drops, and group-level B2B accounts where the unit of analysis is a company rather than a person.
6. GrowthBook
GrowthBook assumes you already own a warehouse and would rather not ship event data anywhere else.
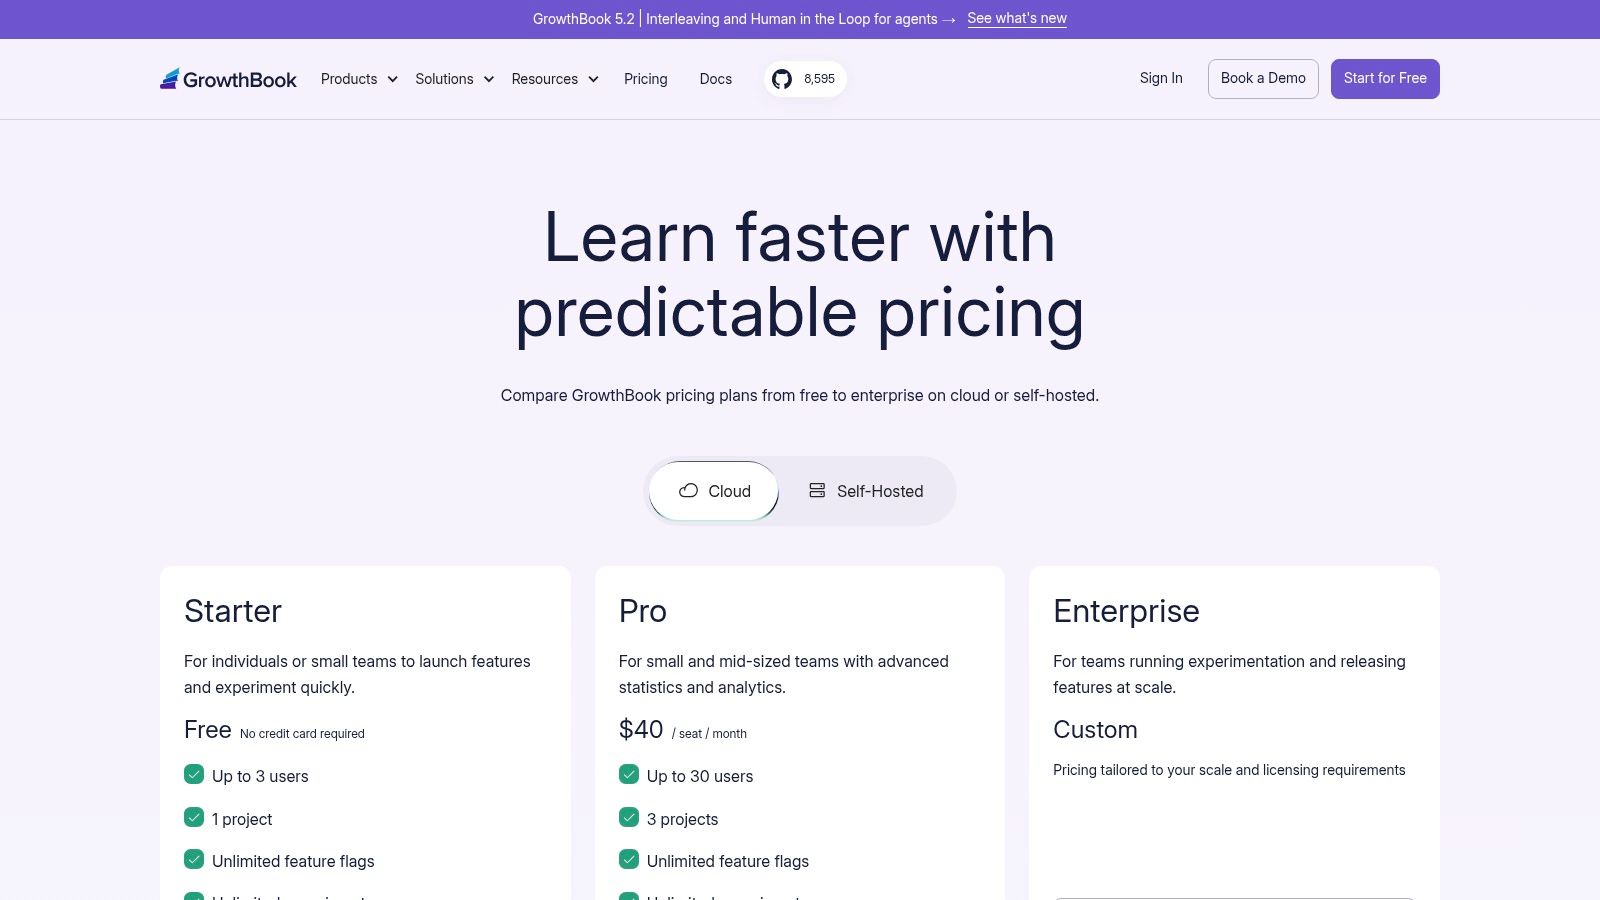
That assumption pays off when teams look at results more than once. Research on the peeking problem explains that continuous monitoring raises the odds random noise eventually looks significant, and one industry implementation reported fixed-horizon A/A tests producing a false-positive rate of about 4.7% when conclusions were drawn only at the planned sample size (peeking and always-valid p-values). Checking a dashboard daily and stopping on the first green number is a different procedure, and it needs a method built for repeated looks. GrowthBook's product page lists sequential testing and CUPED, which is the right shelf for that problem.
Where it strains
Configuration is the price of control. Warehouse connections, metric definitions, and exposure logging take engineering time before the first test runs, and there's no meaningful no-code path for a marketer editing a landing page.
The trade: You swap vendor-managed simplicity for ownership of where the numbers live and who can query them.
I would shortlist GrowthBook when a data team already maintains the pipeline. Without that owner, the setup work lands on one person and stalls.
7. LaunchDarkly
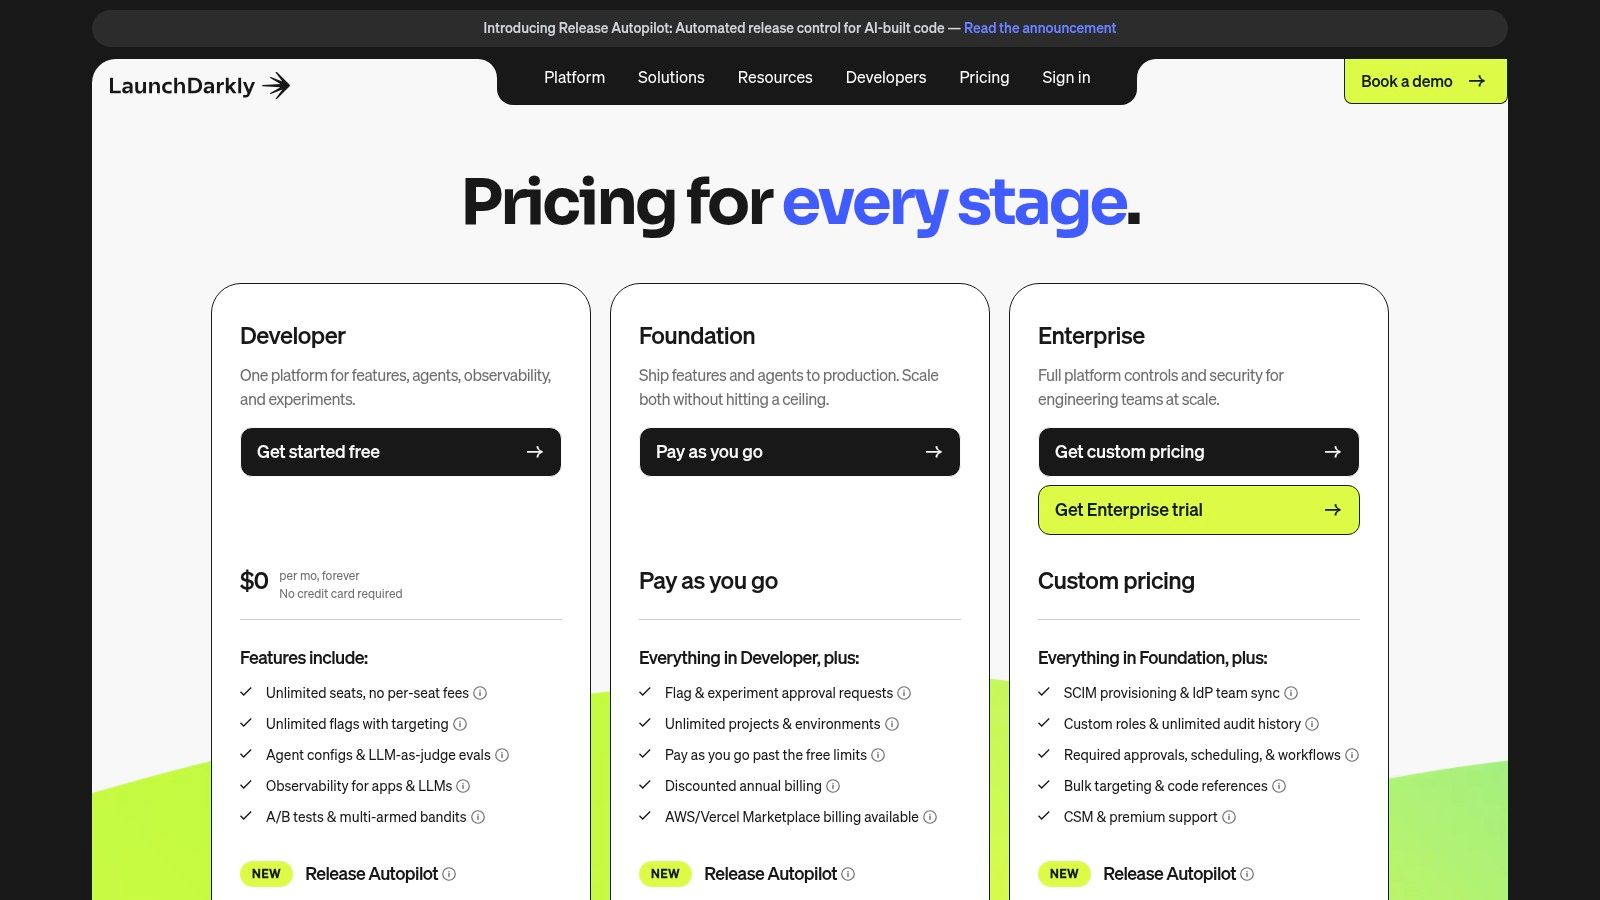
LaunchDarkly starts from the flag, and the experiment falls out of good release hygiene.
Tool access was never the bottleneck. Independent research on 35,262 global startups found 7.6% used A/B testing technology at the start of the study period, 16.75% adopted it at some point across 173 weeks, and average active use in any given week ran about 8.25%, while adopters saw page visits rise by 30% to 100% after a year (NBER working paper on A/B testing adoption). Buying a platform doesn't produce a habit. A flag that already sits in the release path removes the setup step, which is the cheapest way to shorten the gap between the first experiment and the tenth.
How feature flags reduce release risk is the mechanics underneath: one flag, the same audience rules, and a kill switch that works at 2am.
Where it strains
- Code orientation: The workflow is flags and SDKs. Visual page editing isn't the point.
- Usage costs: Client-side active users and service connections drive the bill.
- Enterprise terms: Custom usage terms go through sales.
Name the decision owner before you name the variant. Most stalled experiments die from an unclear owner, not an unclear result.
8. Amplitude Experiment
Amplitude Experiment earns a shortlist slot when your cohorts and metrics already live in Amplitude. Audiences built from product behavior become test audiences without an export, and results land next to the funnel that raised the question.
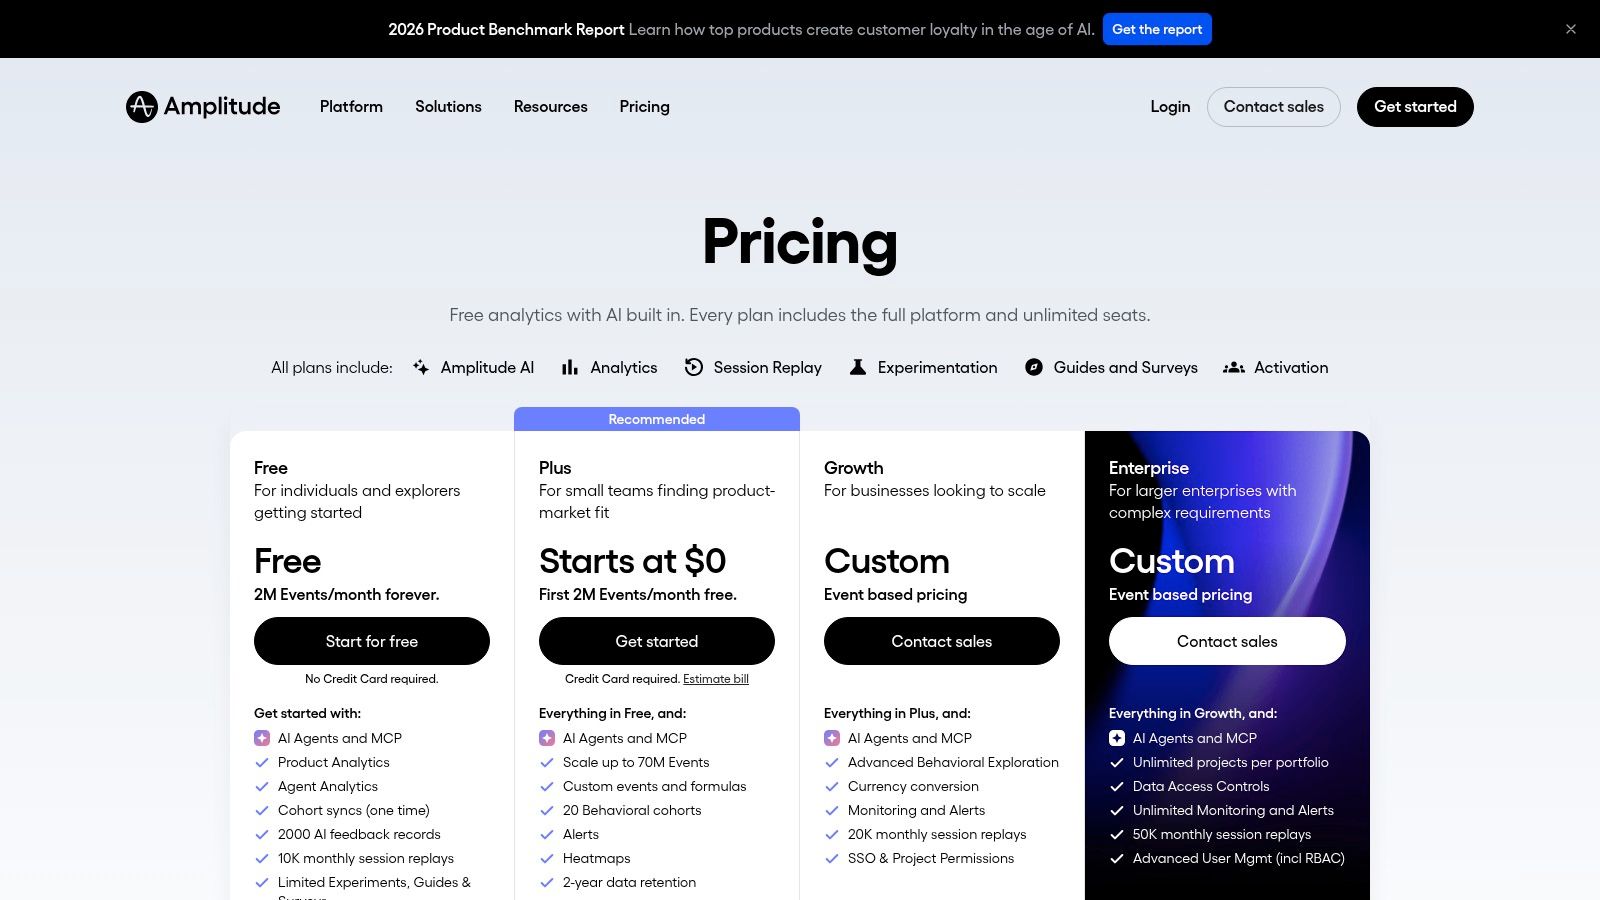
It covers both modes: web experiments through a visual editor, and feature experiments behind flags, with A/B/n testing and targeting on top. Analysis runs on the analytics layer, so funnels, retention, and revenue metrics are available for the same users you exposed.
Where plan limits bite
Free tiers in this category usually cap experiments rather than seats, and that cap is the one that matters. Count the tests you expect per quarter, including the ones that fail, before assuming a free tier covers a whole team.
- Custom pricing: Higher-volume plans are quoted, which makes comparison harder upfront.
- Analytics gravity: The integrated workflow is worth less if your source of truth sits elsewhere.
- Feature tiers: Advanced capabilities vary by plan.
Say a product manager wants to test a new onboarding checklist for workspaces created in the last 30 days. That audience rule is trivial in a product analytics tool and awkward in a page-testing tool, which is the argument for keeping experimentation where the user data already sits.
9. Convert Experiences
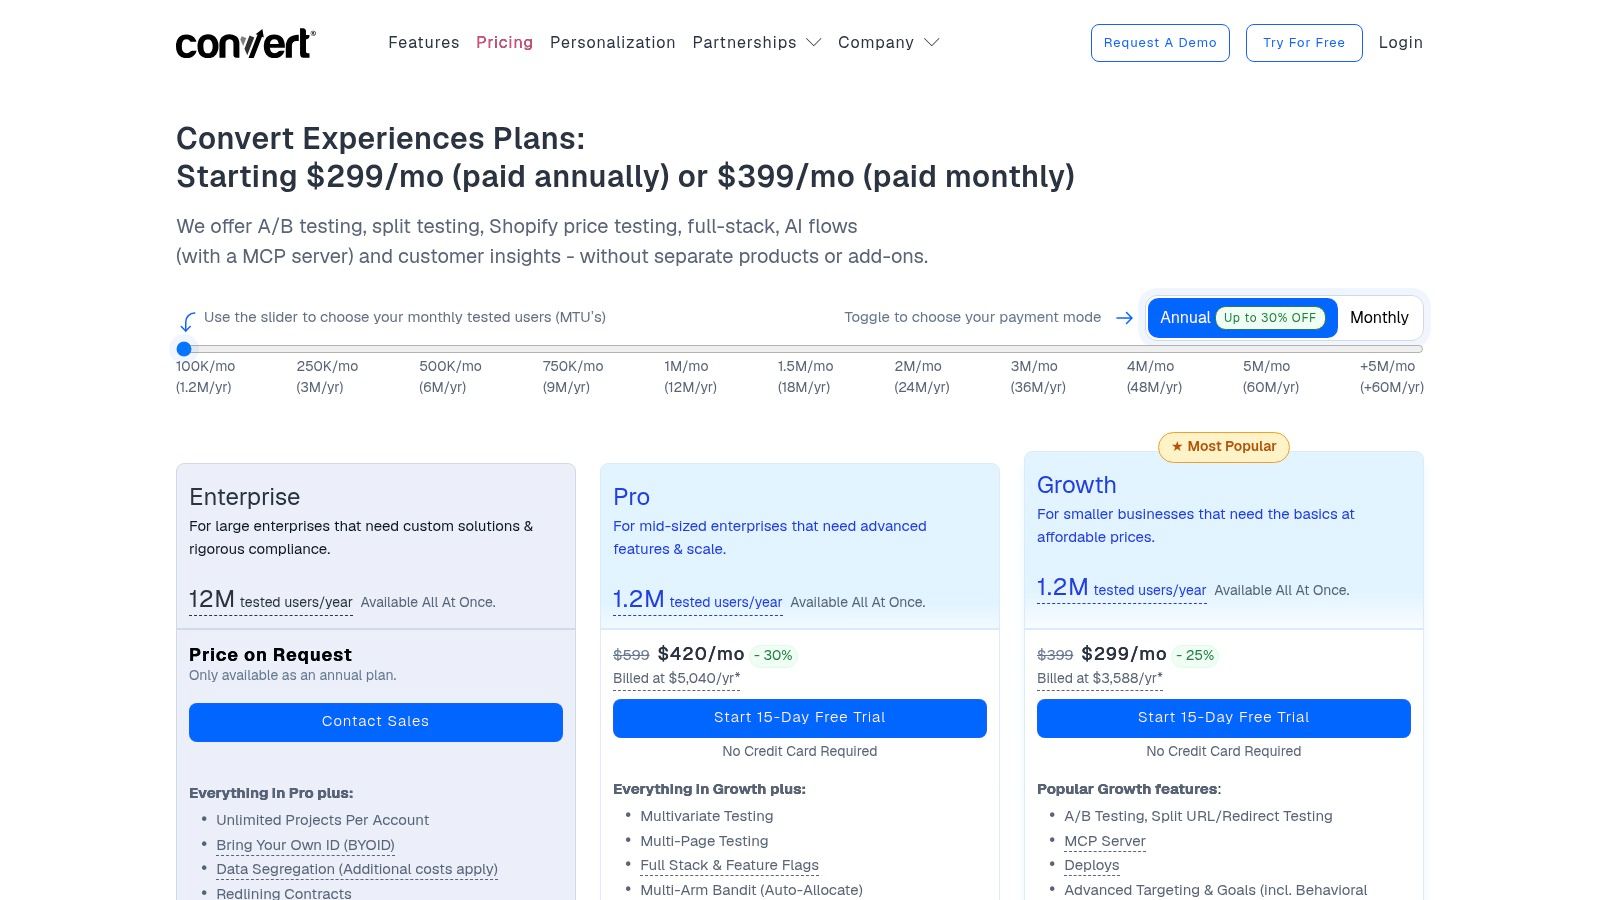
Convert publishes what it costs, which is rarer in this category than it should be. Future Market Insights valued the global A/B testing software market at approximately USD 850.2 million in 2024 (A/B testing statistics), and most of that spend gets negotiated rather than listed. Published entry pricing with tested-user caps, plus a 15-day trial that doesn't require a card on the Convert pricing page, removes one round of guesswork.
What the money buys
A/B and split URL testing, with multivariate, multi-page, and full-stack testing on higher tiers. A visual editor with targeting, heatmaps, privacy-compliant session recordings, and feature flags on the Pro plan according to its pricing page.
Where it strains
- Entry price: It starts above the free developer tools, so the trial needs a real test inside it.
- Tested-user caps: Monthly limits and overage costs set your ceiling on test volume.
- Server-side depth: Its center of gravity is website testing, so a team testing backend logic should check the fit first.
A team running ten page tests a month will find the math straightforward. A team testing pricing logic deep in the stack should look at the flag-first platforms instead.
10. Firebase A/B Testing with Remote Config
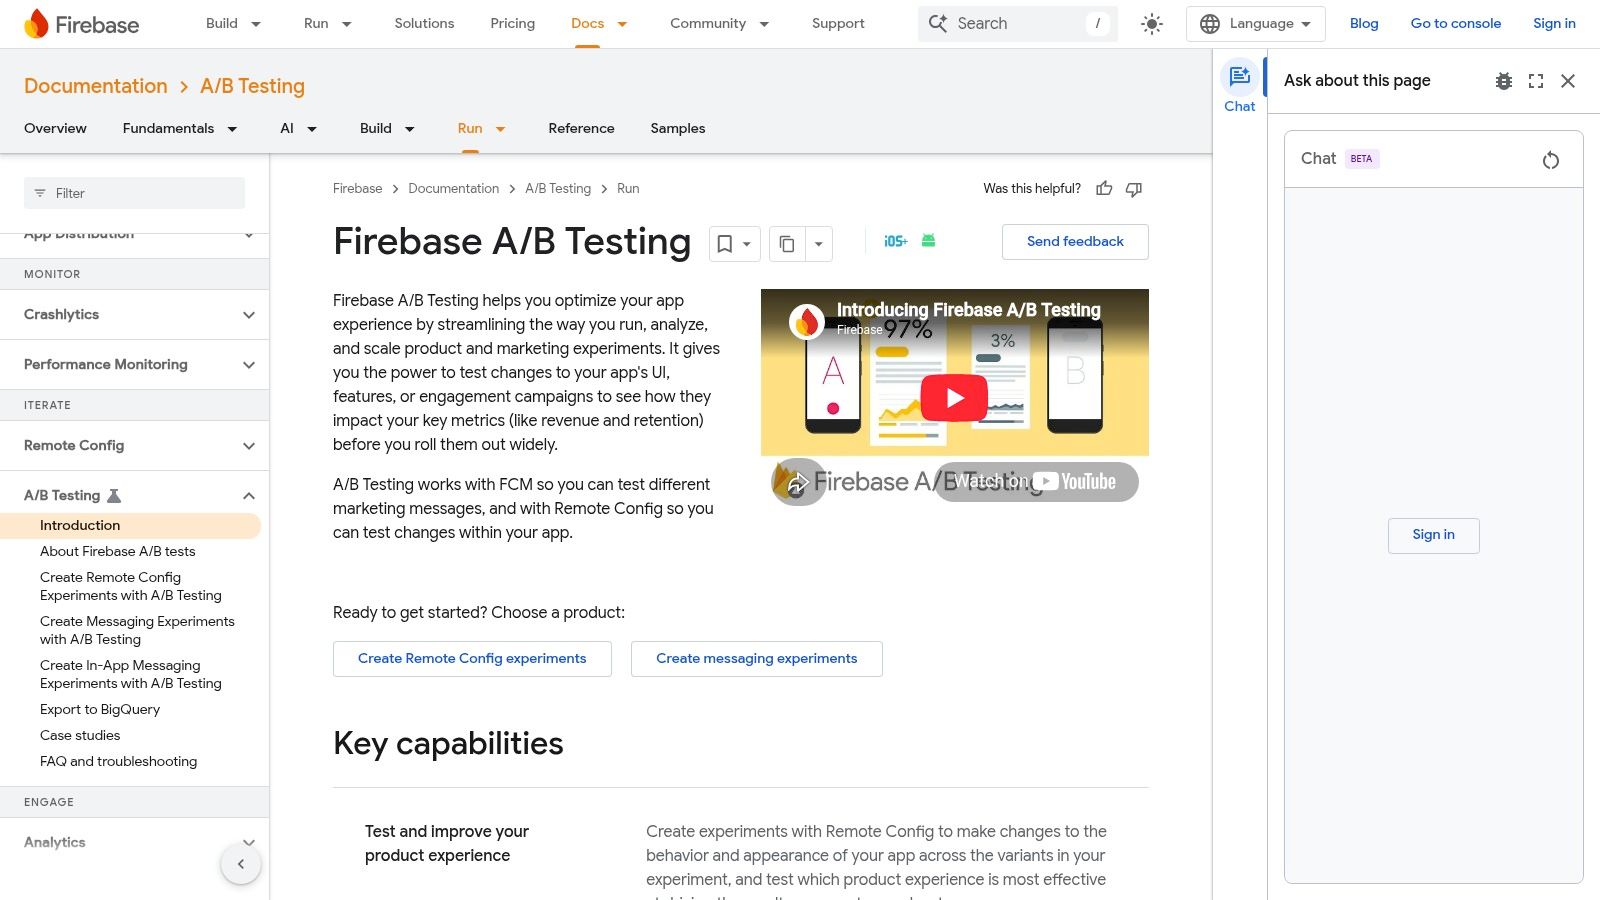
For mobile teams already on Firebase and Google Analytics, this is the cheapest test setup on the list. A test varies Remote Config parameters, assigns audiences, and measures outcomes in Google Analytics, with no second SDK and no new vendor review.
The Firebase documentation covers gradual rollouts and audience segmentation, so the parameter that carries a test can also carry a staged release. Projects share a limit of 24 running experiments and rollouts at once, which is generous for a single app and tight for a portfolio.
Where it strains
- Scope: It's built for app configuration, not for no-code testing of a marketing site.
- Statistics: Advanced methods and warehouse integration sit outside its lane.
- Shared limits: Experiments and rollouts draw from the same running count.
Who it fits
Mobile teams shipping to iOS and Android who want to vary a screen or a config value without adding a platform. Treat it as a configuration tool that can test, rather than a general-purpose experimentation system for a SaaS product with anonymous and logged-in users.
How the 10 A/B testing tools differ on testing focus, analytics connection, pricing visibility, and free options
The deciding split is where the variant lives and where the result gets judged: a visual editor, code behind flags, or the analytics stack the team already trusts.
| Item | Testing focus | Analytics connection | Pricing visibility | Free option |
|---|---|---|---|---|
| Optimizely | Web, product, and feature experimentation | Built-in targeting, metrics, and statistical analysis | Per-product quote; no standard public price | No standard free plan listed |
| VWO | Website and feature experimentation | Related behavior analytics, personalization, and feedback products | No fixed public price; plan inclusions vary | Named-plan free entry; confirm included traffic before relying on it |
| AB Tasty | Website, product, and personalization testing | Goal tracking and real-time reporting | Quote-based; scope-dependent | No free trial; proof of concept may be available |
| Statsig | Product experiments and feature flags | Product analytics and session replay included | Usage-based; Pro pricing is per project | Free Developer tier |
| PostHog | Product experiments, including feature-flag tests | Product analytics, funnels, warehouse metrics, and session replay | Costs tied to feature-flag requests | Free tier |
| GrowthBook | Product experimentation and feature management | Integrates with existing warehouses and data pipelines | Open-source core; paid hosted or enterprise layers | Open-source and self-hosting options |
| LaunchDarkly | Feature and full-stack experimentation | Supports warehouse-backed metrics and experiment analysis | Usage-based; enterprise terms may be custom | Free Developer plan with usage limits |
| Amplitude Experiment | Visual web and code-based feature testing | Integrated analytics, cohorts, funnels, retention, and revenue metrics | Plan-dependent; higher-volume plans are custom-priced | Free plan with limited experiments |
| Convert Experiences | Website A/B, split URL, and advanced testing | Heatmaps and session recordings | Published pricing and tested-user limits | 15-day free trial |
| Firebase A/B Testing with Remote Config | Mobile app tests using Remote Config | Measures outcomes with Google Analytics | No separate experiment line item; usage follows Firebase and Google Analytics | Runs inside an existing Firebase and Google Analytics setup |
Read “pricing visibility” as procurement friction. Published tiers let a team start before legal review; quote-based tools can still fit, but the first real cost estimate arrives only after scope, traffic, and products are defined. The free-option column tells you whether a pilot can start in-product or has to begin as a sales conversation.
Pick the Tool That Fits Your Team's Next Test
Start with one question. Where does your last test decision get stuck? Answer it, and ten platforms collapse into a shortlist of two or three.
- Stuck in the editor: Variants take a week because a developer has to build them. Trial the visual tools first.
- Stuck in release: The test cannot launch because shipping is the risk. Look at the flag-first platforms.
- Stuck in analysis: Nobody trusts the result after it lands. Test the warehouse-native and analytics-native options.
Then spend a week on evidence. Pick two tools from that shortlist and run one small test in each on a trial or free plan, using the same hypothesis and the same primary metric. Compare setup time, time to first valid read, and how clearly the result answers the question you asked. A tool that wins on features but loses two weeks to implementation has already cost you a learning cycle.
The governance question is arriving fast. In Ascend2's research on A/B testing in marketing, 92% of surveyed marketers said AI-driven tools improved their A/B testing processes, with 46% reporting significant improvements, yet only 46% had a detailed, regularly updated testing strategy and 29% had one that was outdated or inconsistently maintained. More variants without a written rationale is how a program generates activity instead of learning.
The tool is the easy part. What scales is a shared definition of a metric, a stopping rule, and an agreement about who declares a winner. The more people who can launch a test, the more those definitions carry the weight, which is why the coordination cost arrives before the license cost does.
If your bottleneck sits earlier, deciding which hypotheses deserve a test at all, Figr turns analytics signals into testable UX questions about why users drop off and what evidence is still missing, then lets you review the UX logic before anyone builds a variant. See a demo of Figr to see how it works with your own funnel data.