

A design team opens a familiar product screen and finds three versions of the same button, each built with different states, tokens, and implementation rules. The system has become reactive, with requests arriving faster than anyone can explain what deserves attention next.
When priorities stay unclear, engineers rebuild patterns, designers bypass libraries, accessibility defects survive into releases, and product teams wait for answers from a small central group. A growing component inventory can hide the harder problem: nobody knows which work will improve adoption, reduce rework, or protect the product from drift.
A design system roadmap turns that confusion into a measurable plan. It connects product evidence to design system priorities, assigns ownership, sequences dependencies, and gives teams a shared reason for what they'll build, fix, migrate, or deliberately leave alone.
What a Design System Roadmap Actually Is
A design system roadmap is a strategic operating model for improving how teams design and ship product experiences. It defines the outcomes the system must support, the foundations and components that need attention, the teams responsible for change, the adoption work required, and the evidence that determines what happens next.
That makes it different from a Jira backlog. A backlog records requests. A roadmap explains why a request matters now, what it depends on, and how the organization will know whether the investment worked.
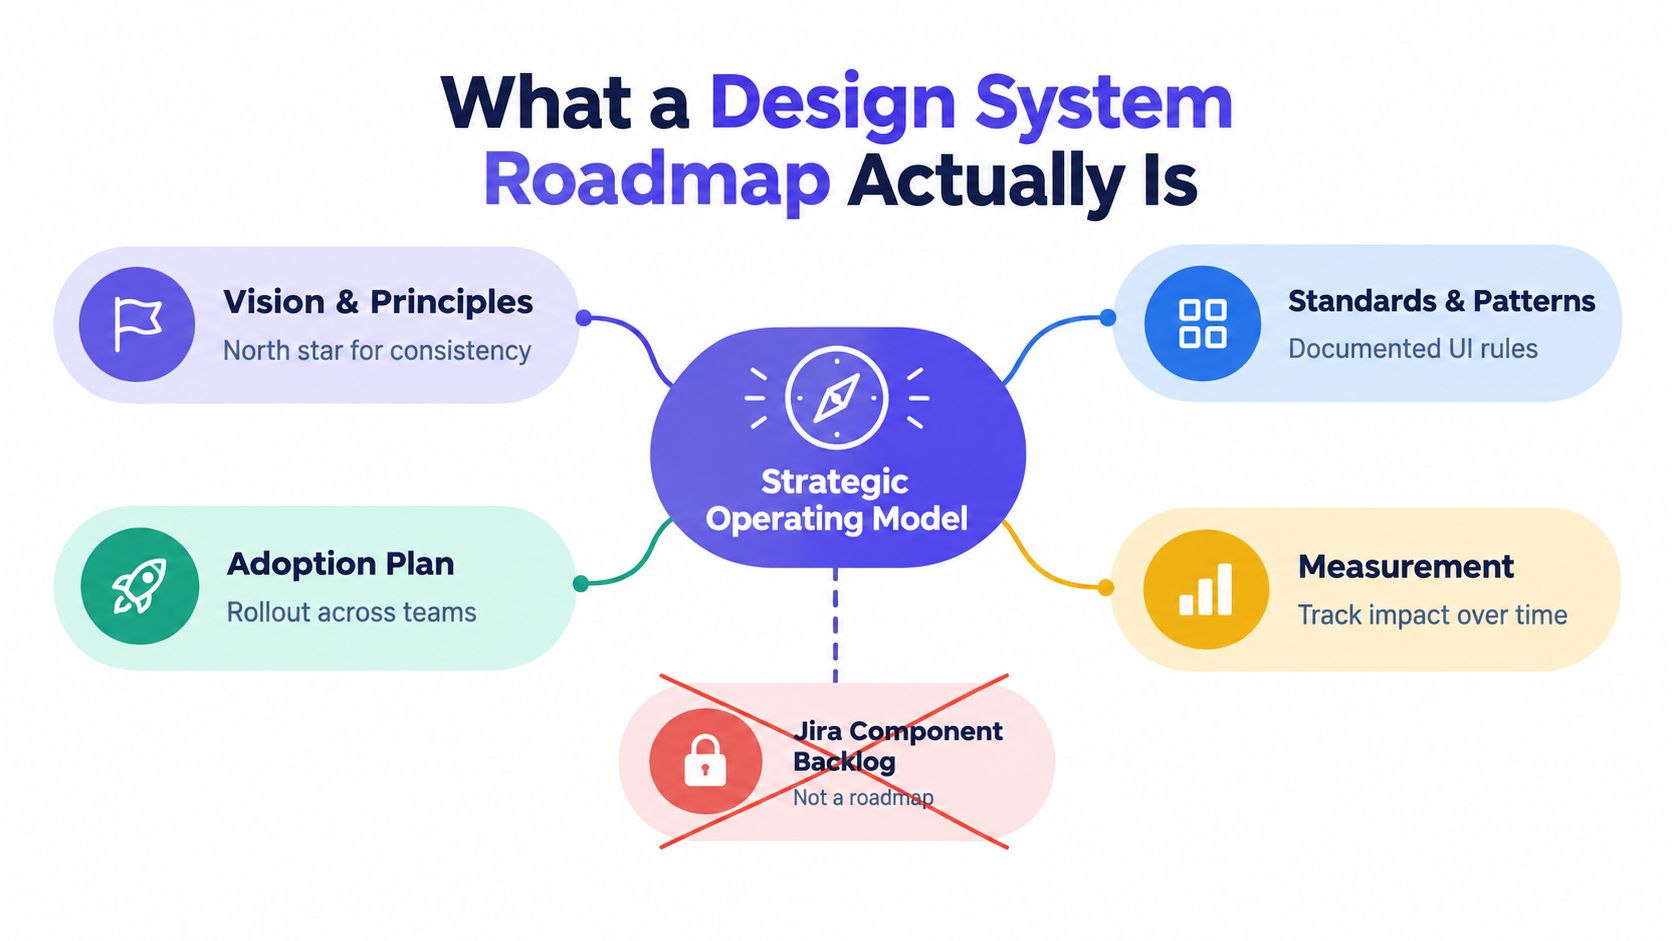
The four things a roadmap connects
A useful roadmap joins four layers of work:
Product reality: The screens, flows, states, defects, and patterns teams use today.
System standards: Tokens, components, interaction rules, accessibility requirements, documentation, and coded implementations.
Organizational adoption: Onboarding, migration support, contribution paths, education, and stakeholder communication.
Operational evidence: Usage, coverage, defect trends, release health, and the time teams spend working around the system.
The history of design systems shows why this broader view matters. Early standardization efforts emerged alongside computing in the 1960s and 1970s. Graphical interfaces in the 1980s led to platform-specific standards such as Apple's Human Interface Guidelines and Microsoft's Windows UX guidelines. Yahoo's Design Pattern Library and Yahoo User Interface Library, released in 2006, helped make documented interface patterns visible beyond individual products. Google introduced Material Design in 2014, Salesforce introduced the Lightning Design System in 2015, and IBM introduced Carbon in 2018. These milestones are summarized in this history of design systems.
The pattern is clear. Systems move from visual guidance to reusable infrastructure that connects design decisions with engineering delivery across products and teams.
What it isn't
A component backlog might contain “build data table,” “add toast,” and “update button states.” A roadmap adds the missing decisions: which product surfaces use each pattern, what accessibility risk exists, whether the code API is ready, who owns migration, and which release can absorb the change.
A design system strategy defines the long-term direction, operating principles, and investment model. A roadmap turns that direction into sequenced initiatives.
A maturity assessment describes the current state. It can reveal weak documentation, low adoption, or design-code drift, but it doesn't decide what to do first.
A governance process defines how decisions, contributions, and releases work. It supports the roadmap, but it isn't the roadmap itself.
Practical rule: If an item has no outcome, owner, dependency, or evidence of completion, it's probably a request rather than a roadmap initiative.
A roadmap limited to color, typography, and component inventory addresses only the earliest layer of system maturity. The stronger model treats the system as shared organizational infrastructure. For a broader foundation, see Figr's Design Systems Guide.
How to Create a Design System Roadmap Step by Step
Create a design system roadmap by starting with the live product, translating observed gaps into outcomes, and sequencing the work around dependencies and adoption capacity.
A friend at a Series C company once described their roadmap review to me. The team had planned several polished components, yet engineers were still hand-fixing missing focus states and designers were copying old modal variants. The problem wasn't ambition. It was that nobody had audited the product before selecting the work.
A practical sequence
Audit live patterns. Inventory real screens and flows, not only the library.
- Record duplicated components, local overrides, hardcoded values, missing states, and accessibility defects.
- Capture where teams use approved patterns and where they work around them.
- Include production behavior, because a component that looks correct in Figma may fail in loading, error, empty, or permission states.
Assess coverage and risk. Compare eligible product surfaces with approved design and coded patterns.
Coverage should include components, tokens, variants, responsive behavior, content guidance, and accessibility requirements. A frequently used input with poor error handling usually deserves attention before a rarely used decorative pattern.
Gather cross-functional needs. Ask Product, Design, Engineering, QA, support, and accessibility specialists what slows delivery.
Product Managers can identify upcoming feature dependencies. Designers can show repeated interaction problems. Engineers can expose unstable APIs or migration costs. QA can reveal recurring defects that documentation never mentions.
Define outcomes. Convert observations into statements someone can verify.
Examples include reducing handoff rework, increasing approved component usage on targeted surfaces, closing a known keyboard interaction gap, or making a high-frequency pattern available in both Figma and code.
Map dependencies. Identify prerequisites before assigning release dates.
A component may depend on token naming, theming architecture, icon changes, content rules, Storybook work, test coverage, or a consuming product team willing to migrate. Teams can use this workflow dependency guide to structure those relationships.
Prioritize and estimate. Score initiatives with a visible method, then estimate design, engineering, documentation, migration, and enablement effort separately.
Assign ownership. Name a directly responsible lead and supporting contributors. Shared responsibility without a decision owner produces slow decisions.
Plan releases. Group work into releases that teams can adopt. Each release should include implementation, documentation, communication, migration guidance, and validation.
The exact sequence matters because a component request without product evidence is guesswork. A roadmap built from the product outward gives leadership something defensible: a record of the problem, the proposed intervention, the cost, and the signal that will confirm progress. Figr's process for design system creation and implementation offers additional context for connecting system work to delivery.
How to Prioritize Design System Initiatives
Prioritize design system initiatives by scoring product impact, reuse potential, accessibility risk, adoption demand, effort, and dependencies with the same visible method for every request.
The loudest request shouldn't automatically win. A new data table may have executive visibility, while a button's missing focus state affects every product flow. These initiatives need different treatment, and a scorecard makes the trade-off easier to explain.
A transparent scorecard
Use a simple scale for each positive factor, where higher values indicate greater impact, reuse, risk, or demand. Score effort separately, because higher effort reduces priority. You can adapt the weights to your organization, but document them before reviewing requests.
The totals use a simple rule: Product Impact + Reuse Potential + Accessibility Risk minus Effort. The values are hypothetical, not an industry benchmark.
The button fix rises because it combines broad reach, strong reuse, and serious accessibility exposure with limited effort. The data table remains important, but its larger implementation surface means the team should first confirm requirements, API design, responsive behavior, sorting, pagination, empty states, and consuming teams.
Separate repairs from expansion
Critical fixes deserve a different path from net-new components:
Critical fixes: Keyboard failures, missing labels, broken focus behavior, incorrect tokens, and regressions that affect existing consumers.
Adoption blockers: Confusing APIs, poor documentation, missing examples, difficult installation, or migration friction.
High-impact additions: Patterns that multiple product areas need and can adopt within the planned release.
Exploratory requests: New ideas that require product validation before entering the core system.
Where to start with Figr's action priority matrix is where teams can frame urgency against impact without treating every request as equal.
The best scorecard is one people can challenge. A transparent disagreement improves the roadmap. A hidden judgment creates politics around every release.
Scoring isn't a substitute for judgment. An accessibility issue may need immediate remediation even when reuse is limited. A foundational token change may score modestly on visible product impact while enabling many future initiatives. Use the numbers to reveal assumptions, then record the decision and its rationale.
Design System Roadmap Example for a 90-Day Plan
A hypothetical B2B SaaS company can use a 90-day design system roadmap to move from scattered evidence to a controlled adoption cycle without promising a full-library rewrite.
The product has several dashboard surfaces, complex forms, account settings, and an expanding admin area. Designers use a shared Figma library, but coded components have drifted, and teams disagree about which states belong in the system.
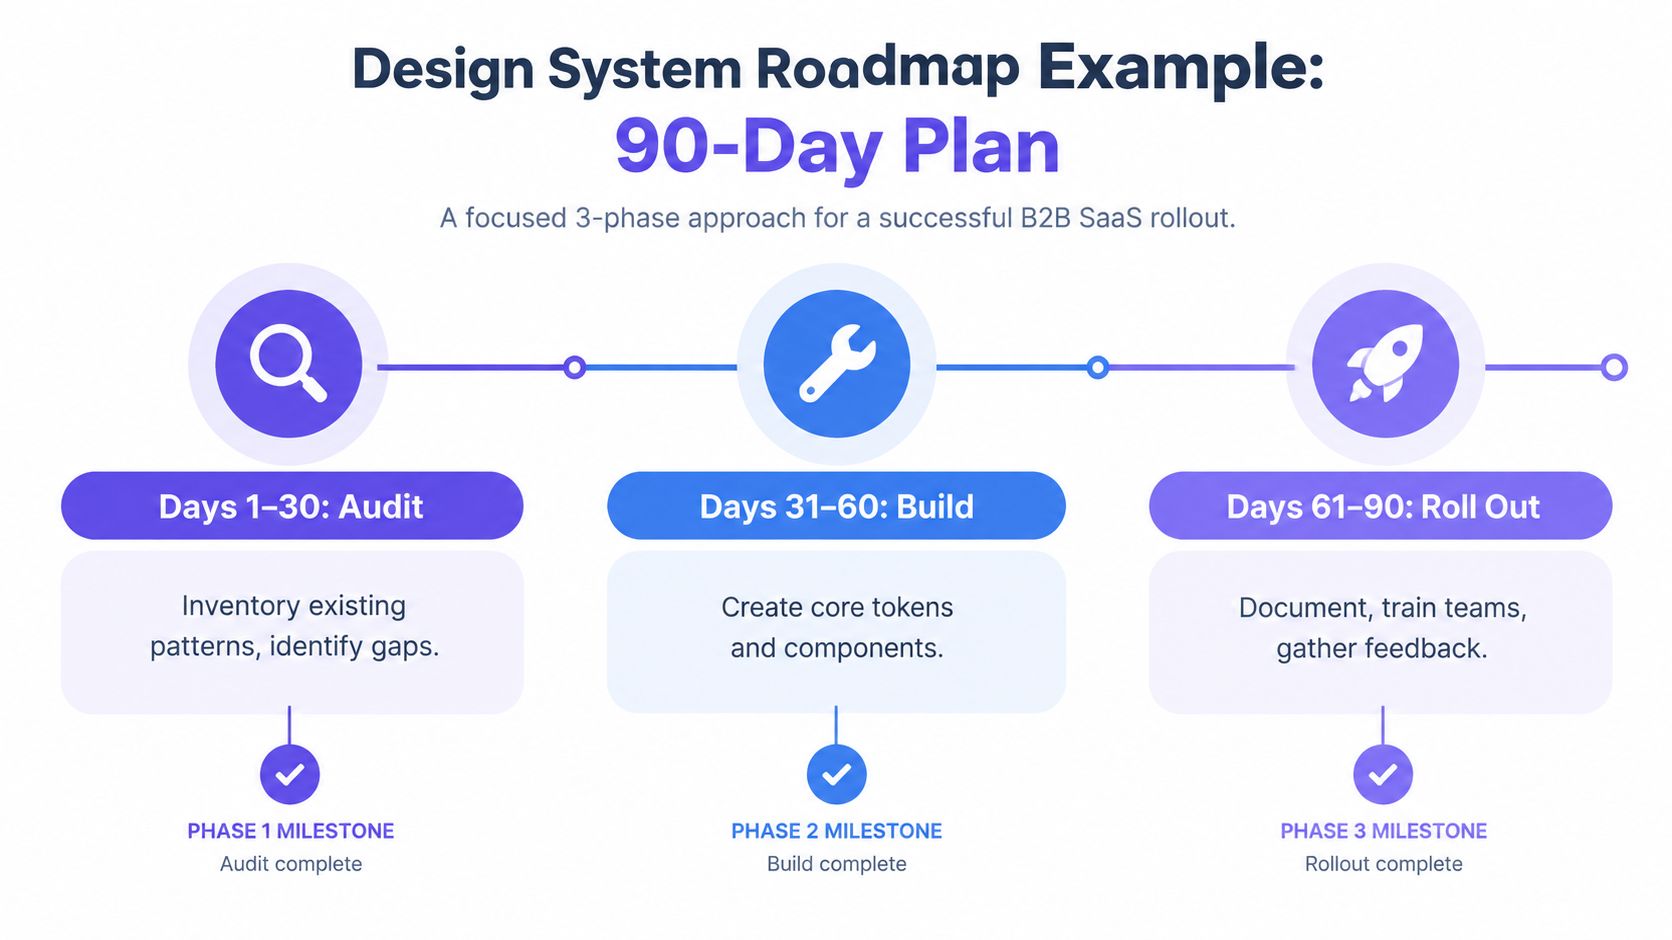
Days 1 to 30, audit and align
The Design System Lead owns the inventory. A Product Manager identifies upcoming feature dependencies, while Design and Engineering compare Figma components with coded implementations.
Milestone: A prioritized baseline exists by the end of the first phase.
Deliverables:
Pattern inventory covering high-traffic flows and key product states.
Token and component comparison across design and code.
List of accessibility defects, local overrides, and adoption blockers.
Stakeholder interviews and a decision log.
Initial scorecard with owners and dependencies.
Success measures: The team can name the highest-risk patterns, identify consuming product teams, and distinguish system defects from product-specific experiments.
Days 31 to 60, fix and align
Design and Engineering pair on the highest-scoring work. They repair critical states, clarify variants, update documentation, and establish parity between Figma components and coded components.
The accessibility specialist reviews keyboard interaction, focus visibility, labels, error messaging, contrast, and responsive behavior. Product teams validate whether the new guidance works inside real feature work.
Milestone: A small release candidate is available for representative consumers.
Dependencies: Token decisions must precede component updates. Code API changes need migration guidance. Documentation must be ready before teams are asked to adopt the release.
Days 61 to 90, roll out and learn
The team publishes the release, runs enablement sessions, supports migration, and checks usage on selected product surfaces. The Product Manager gathers feedback from consuming teams, while Engineering monitors defects and version distribution.
Milestone: The release has documented consumers, known exceptions, and a next-cycle recommendation.
Success measures: Approved component usage increases on targeted surfaces, critical accessibility defects decline, migration blockers are recorded, and teams can explain when to use the updated patterns.
The point of this hypothetical plan isn't to finish every component. It's to create a complete learning loop, from evidence to release to adoption signal.
How to Manage Design System Roadmap Ownership
Roadmap ownership works when one person coordinates decisions while each discipline owns the quality of its contribution.
The Design System Lead maintains the roadmap, prepares trade-offs, keeps the inventory current, and makes unresolved decisions visible. The Product Manager connects initiatives to product priorities, release windows, and investment conversations. Designers define behavior, states, usage guidance, and interaction quality. Engineers own component APIs, implementation constraints, testing, versioning, and migration feasibility. Accessibility specialists turn inclusive requirements into acceptance criteria and review representative journeys.
Make intake useful
A request should include:
The product problem and affected surface.
Existing patterns that were considered.
Evidence of reuse or user impact.
Accessibility and content considerations.
Design and code dependencies.
Proposed owner and consuming teams.
Desired timing, with a reason rather than a preference.
This keeps intake from becoming a suggestion box. A request enters discovery first, then receives a decision such as accept, defer, redirect to a product repository, or reject because an existing pattern already solves the problem.
Give feedback a route
Stakeholder feedback should arrive through scheduled reviews, contribution proposals, issue tracking, and release notes. Slack can surface a problem, but it shouldn't become the permanent record of a system decision.
Governance research consistently points to collaboration, feedback processes, version control, and documentation as core mechanisms. That principle is practical: if contributors can't see how a decision was made, they'll recreate the debate in every team.
Treat releases as product releases
A system release needs more than a package publish. It may require migration examples, deprecation timing, Figma updates, documentation changes, office hours, and a named contact for adoption questions.
The 2022 Sparkbox Design Systems Survey reported that only 44% of teams had a governance model or product roadmap, while 16% tracked metrics. Those figures show why ownership and measurement belong in the operating model rather than being left to goodwill.
Which KPIs Measure Roadmap Success
Measure roadmap success through adoption, quality, alignment, and delivery friction, not through the number of components published.
A component count answers a narrow question: how much exists. Leadership usually needs better answers. Are teams using the system on eligible surfaces? Are design and code describing the same behavior? Are defects falling? Does the system reduce rework rather than create another review queue?
Core formulas
These formulas are starting points, not universal definitions. Define the denominator carefully. “Eligible surfaces” might exclude experiments, legacy screens scheduled for retirement, or deliberately local patterns. Without that context, adoption can look healthy while the most important teams remain outside the system.
Add quality signals
Track accessibility defect density by component, recurring violation types, manual review findings, and pass rates for critical flows. WCAG 2.2 AA provides concrete acceptance criteria, including a 4.5:1 minimum contrast ratio for normal text, 3:1 for large text, and 3:1 for user-interface components and graphical objects. These requirements are detailed in this WCAG contrast guidance.
State coverage deserves its own measure. Count documented and tested states across default, hover, focus, disabled, loading, error, empty, permission, responsive, and reduced-motion conditions. A component that only works in its happy path creates future product debt.
For a deeper measurement framework, see how to measure and prove design system impact. Report trends with context, explain exceptions, and connect system indicators to product delivery outcomes.
Common Design System Roadmap Mistakes to Avoid
Roadmaps often fail before the first release because teams measure visible output instead of whether the system changes how products are designed and shipped.
Mistake one, counting components instead of adoption
A large library can remain peripheral to delivery. A 2026 survey of 147 practitioners found that 7% described their system as fully adopted across all teams, while 31% reported wide adoption. The same report identified adoption and awareness as the leading challenge for the fifth consecutive year, with organizational buy-in satisfaction at 32%. These findings appear in the enterprise design system operating model report. For a deeper look at why systems stall, see why design systems fail to get adopted.
Set adoption targets by product area, fund migration support, and review exceptions openly. The roadmap should show which teams use the system, where usage stops, and what prevents wider adoption.
Mistake two, adding components before removing friction
Every component creates maintenance, documentation, testing, and support obligations. If teams cannot find it, understand its API, or migrate safely, another addition increases the system's surface area without increasing its usefulness. Prioritize discoverability, practical examples, contribution response time, and migration guidance when those constraints block adoption.
Mistake three, ignoring engineering dependencies
A polished Figma component can stall when the code architecture lacks theming, state handling, testing, or a stable API. Product teams then ship local variants while waiting, creating patterns the system will later need to reconcile.
Include engineering discovery in estimation. Plan design, code, documentation, visual regression, and release work as one initiative, with dependencies visible before the work enters delivery.
Mistake four, launching migrations without support
Migration work competes with feature delivery. A release note will not resolve unclear ownership, incompatible props, or product-specific exceptions.
Name consuming teams, publish a migration path, reserve upgrade capacity, and track version distribution. One enterprise operating model recommends monitoring which version each application runs so platform debt becomes visible. Its example describes 40% of applications sitting three major versions behind, a figure tied to that specific model rather than a general benchmark. See the maintenance and versioning guidance.
Mistake five, treating accessibility as a final audit
WebAIM's Million audit, cited in UXPA materials, found that 95.9% of one million home pages failed WCAG 2.0 AA. Common failures included low-contrast text on 81.0%, missing image alternative text on 54.5%, and missing form labels on 48.6% of pages. The figures are reported in the UXPA accessibility materials.
Put accessibility acceptance criteria into tokens, components, automated checks, and representative manual testing before release. A roadmap should know when to stop building and start removing friction. The next component may offer less value than better guidance, migration support, or a smaller, clearer API.
How Figr Supports Design System Roadmap Execution
Figr supports roadmap execution by grounding design exploration and handoff in a team's existing product context, while people still decide priorities, ownership, release policy, and governance.
Its Design System Intelligence can use existing tokens, components, variants, states, and usage rules to support designs aligned with current patterns. A team can combine product screens with imported Figma context, then inspect where a pattern is missing, ambiguous, or difficult to reuse. That makes the audit phase more concrete, especially when a roadmap depends on understanding what already exists.

Five layers of product context
Consider the hypothetical B2B SaaS example from the 90-day plan:
Visual: Screens show that dashboards use several card, table, and filter variations.
Behavioral: Flows reveal loading, empty, permission, error, keyboard, and responsive states that static screens miss.
Design System: Tokens and components expose which patterns are approved, incomplete, duplicated, or inconsistently named.
Product Knowledge: PRDs and research explain why an admin workflow needs particular permissions, content, or sequencing.
Implementation: Code constraints show which APIs, props, tokens, and supported engineering workflows can ship safely.
Together, these layers form Figr's Visual Context Graph. The value lies in connecting a proposed improvement to the product conditions around it. A new table pattern can be explored with realistic states, compared with existing usage, and prepared for a clearer handoff rather than designed as an isolated artifact.
Figr's Context Pod can help preserve relevant product context. Custom Skills can encode team-specific instructions and review approaches. Multi-state prototypes help teams inspect behavior beyond the default screen, while Direct Editing supports focused iteration. Figma Sync connects the resulting work to the design workflow, and Figr MCP supports documented engineering workflows where the integration is configured for that use.
These capabilities can accelerate exploration, state coverage, design review, and design-to-development communication. They don't decide which initiative deserves funding, measure organization-wide adoption automatically, approve breaking changes, or replace contribution governance. Those remain human responsibilities.
The useful boundary is clear: AI can help teams see context and produce aligned artifacts. Leaders still decide what the organization will adopt and maintain.
Use the roadmap as the decision layer, then use product context to make each initiative more accurate and easier to execute.
Figr connects existing product screens, Figma context, system patterns, and implementation constraints so teams can explore roadmap work with fewer assumptions. Visit Figr to evaluate how its design intelligence, multi-state prototyping, and supported engineering workflows can fit into your next roadmap cycle.
FAQ
What is a design system roadmap?
A design system roadmap is a sequenced plan for improving system foundations, components, documentation, accessibility, adoption, design-code alignment, and operational ownership. It explains what will change, why it matters, who owns it, and how progress will be measured.
How do you create a design system roadmap?
Audit live product patterns first, assess coverage and risk, gather Product, Design, Engineering, QA, and accessibility needs, define outcomes, map dependencies, score initiatives, assign owners, and plan releases with adoption support.
What should a design system roadmap include?
Include goals, initiatives, components, tokens, documentation, accessibility requirements, adoption work, design-code parity, owners, dependencies, milestones, release plans, and KPIs. A component inventory alone isn't enough.
How do you prioritize design system components?
Score each initiative by product impact, reuse potential, accessibility risk, adoption demand, effort, and dependencies. Separate critical repairs and adoption blockers from net-new component requests.
How often should a design system roadmap be updated?
Review it whenever product priorities, system health, dependencies, or adoption evidence changes. A quarterly planning cycle works for many teams, with lighter reviews during active releases.