
FIGR / UI TEMPLATE
Identify unresolved receivables by payer and age bucket.
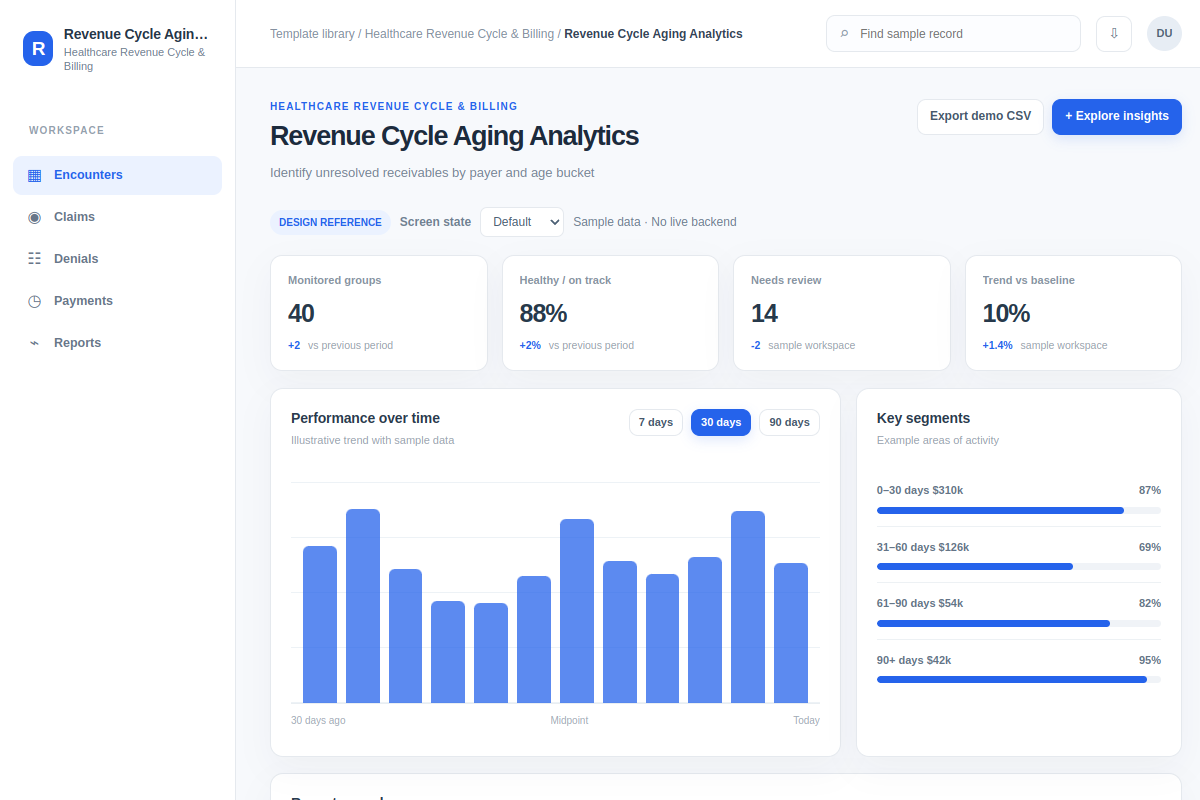
This analytics offers a reference for teams working in Healthcare Revenue Cycle & Billing products. Review fictional records such as 0–30 days $310k and 31–60 days $126k, then adapt the flow, components and rules to your existing product.
BUILD ON THIS
Explore this screen, then bring in your own product and design system to shape the next version.
Analytics
Explore insights
analytics with relevant records, filters, selections and task feedback
Default, Selected, Filtered, Empty, Loading, Warning, Error, Success
Independent product UI reference; no 1mg design-system assets
Find and review 0–30 days $310k and 31–60 days $126k, identify what needs attention, and explore insights with the right context.
Encounters → Claims → Explore insights
analytics, selected-record details, search, filters, status, task feedback
Show data units, date windows and when each metric last refreshed.
Design Revenue Cycle Aging Analytics for our current product. Read our existing UI, component library, flows and permissions first. Help users explore insights for cases like 0–30 days $310k and 31–60 days $126k. Explore two layouts, compare trade-offs and build a version our designers can edit. Cover selected, filtered, empty, loading, warning, error, success and permission edge cases. The examples here are fictional.
KEEP EXPLORING
Browse other product UI examples, compare patterns, and pick the direction that suits your product.