
FIGR / UI TEMPLATE
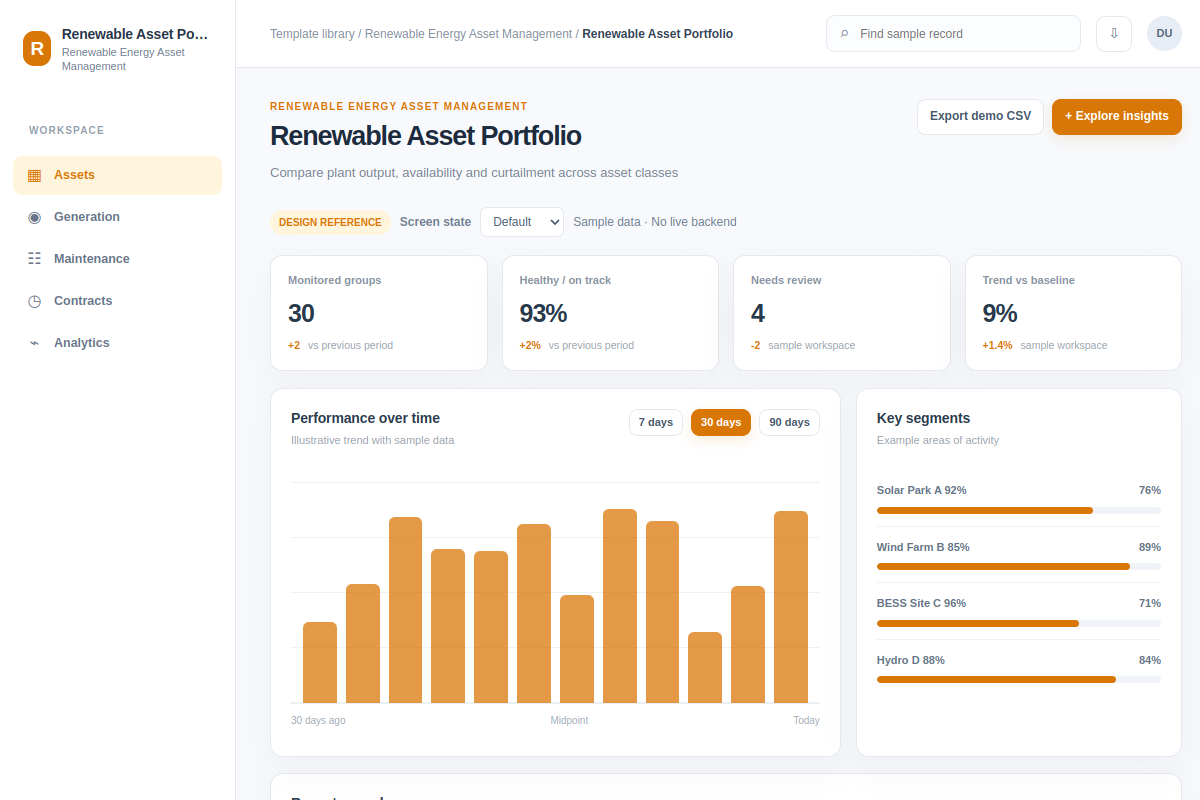
Compare plant output, availability and curtailment across asset classes.
Explore this analytics as a reference for renewable energy asset software. Review the steps and edge cases, then adapt it to your existing product and design system. All example records are fictional.
BUILD ON THIS
Explore this screen, then bring in your own product and design system to shape the next version.
Analytics
Compare plant output, availability and curtailment across asset classes
analytics workflow
Default, Selected, Filtered, Empty, Warning, Success
Independent product UI reference
Compare plant output, availability and curtailment across asset classes.
Core areas: Asset Portfolio, Generation, Maintenance, Dispatch and Reports. Main task: Compare plant output, availability and curtailment across asset classes. Show affected assets, owners and clear status.
Default, Selected, Filtered, Empty, Warning, Success. Cover missing telemetry, restricted access, unavailable assets, failed changes and retries where relevant.
Asset Portfolio → Renewable Asset Portfolio → Compare plant output, availability and curtailment across asset classes
analytics, filters, status labels, record details
Label the time window, units and source of each metric. Separate missing telemetry from a reading of zero, and let users inspect assets behind a trend.
Show asset identifiers, timestamps and data freshness. Distinguish missing telemetry, access limits and genuine alerts. Provide a recovery step after a failed change.
Adapt Renewable Asset Portfolio to my existing renewable energy product and design system. Use our components, asset hierarchy, permission rules and operational constraints. Review edge cases before creating editable screens.
KEEP EXPLORING
Browse other product UI examples, compare patterns, and pick the direction that suits your product.