
FIGR / UI TEMPLATE
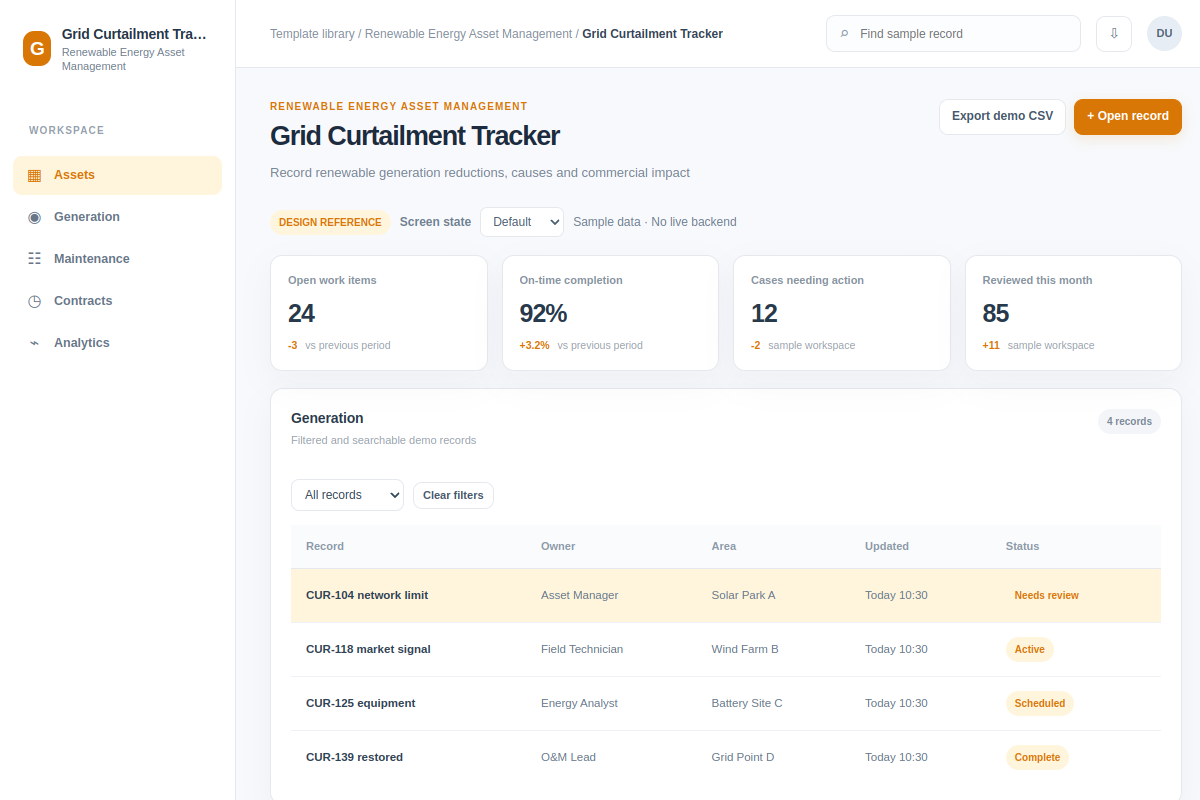
Record renewable generation reductions, causes and commercial impact.
Explore this table as a reference for renewable energy asset software. Review the steps and edge cases, then adapt it to your existing product and design system. All example records are fictional.
BUILD ON THIS
Explore this screen, then bring in your own product and design system to shape the next version.
Table
Record renewable generation reductions, causes and commercial impact
table workflow
Default, Selected, Filtered, Empty, Warning, Success
Independent product UI reference
Record renewable generation reductions, causes and commercial impact.
Core areas: Asset Portfolio, Generation, Maintenance, Dispatch and Reports. Main task: Record renewable generation reductions, causes and commercial impact. Show affected assets, owners and clear status.
Default, Selected, Filtered, Empty, Warning, Success. Cover missing telemetry, restricted access, unavailable assets, failed changes and retries where relevant.
Asset Portfolio → Grid Curtailment Tracker → Record renewable generation reductions, causes and commercial impact
table, filters, status labels, record details
Keep contract or asset identifiers, due dates and required actions visible during filtering. Show where evidence is missing.
Show asset identifiers, timestamps and data freshness. Distinguish missing telemetry, access limits and genuine alerts. Provide a recovery step after a failed change.
Adapt Grid Curtailment Tracker to my existing renewable energy product and design system. Use our components, asset hierarchy, permission rules and operational constraints. Review edge cases before creating editable screens.
KEEP EXPLORING
Browse other product UI examples, compare patterns, and pick the direction that suits your product.