
FIGR / UI TEMPLATE
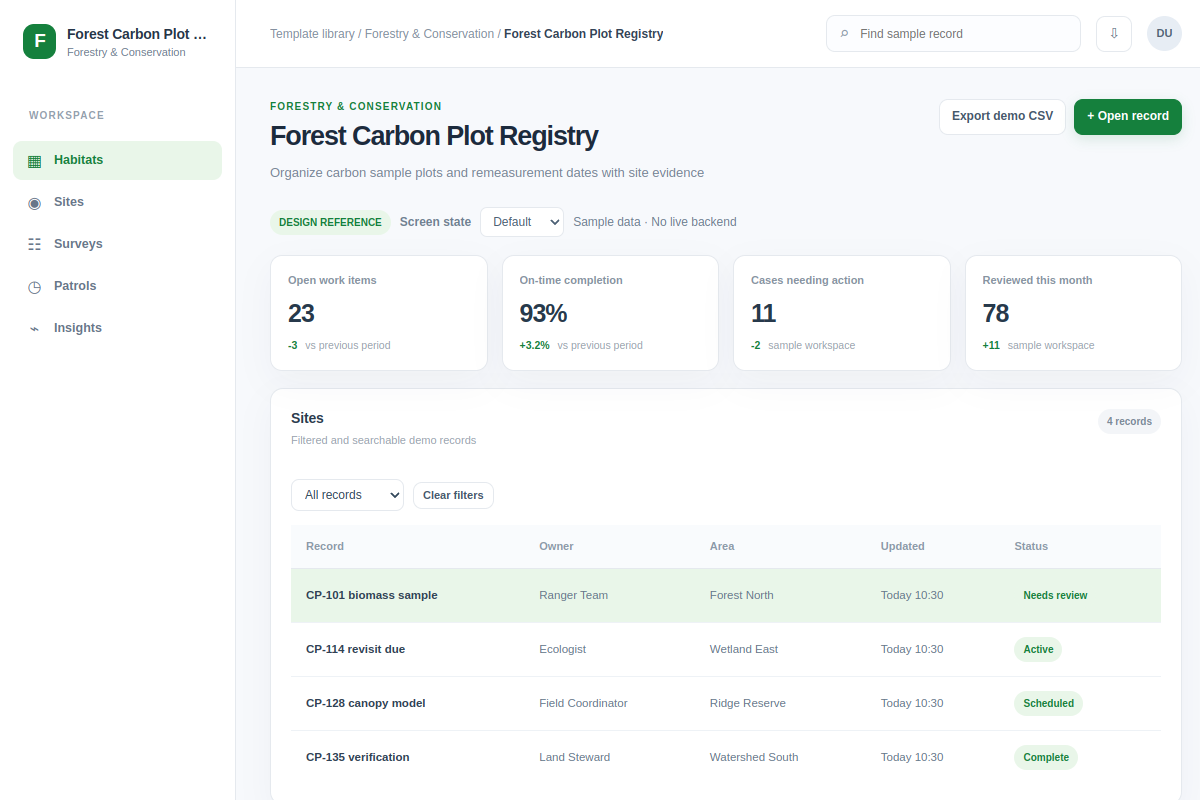
Organize carbon sample plots and remeasurement dates with site evidence.
Explore this table workflow as a reference for forestry and conservation software. Review its actions and edge cases, then adapt the screen to your product and design system. All example data is fictional.
BUILD ON THIS
Explore this screen, then bring in your own product and design system to shape the next version.
Table
Organize carbon sample plots and remeasurement dates with site evidence
table workflow
Default, Selected, Filtered, Empty, Warning, Success
Independent product UI reference
Organize carbon sample plots and remeasurement dates with site evidence.
Core areas: Sites, Field Surveys, Species, Conservation Projects and Reports. Main task: Organize carbon sample plots and remeasurement dates with site evidence. Include site identifiers, owners and record status.
Default, Selected, Filtered, Empty, Warning, Success. Add missing evidence, offline field notes, permission checks and failed saves where relevant.
Field Overview → Forest Carbon Plot Registry → Organize carbon sample plots and remeasurement dates with site evidence
table, record details, status labels, filters
Show plot identifiers, species, survey dates and units. Let teams filter by area without losing the record they were reviewing.
Keep survey dates and sources visible. Mark estimates as estimates and give field teams a way to recover from missing or delayed data.
Adapt Forest Carbon Plot Registry to my existing conservation product and design system. Reuse our site and species data, field-work rules and interface components. Cover missing evidence and edge cases before creating editable screens.
KEEP EXPLORING
Browse other product UI examples, compare patterns, and pick the direction that suits your product.