
Read product usage, key metrics, segments and performance changes in one place.
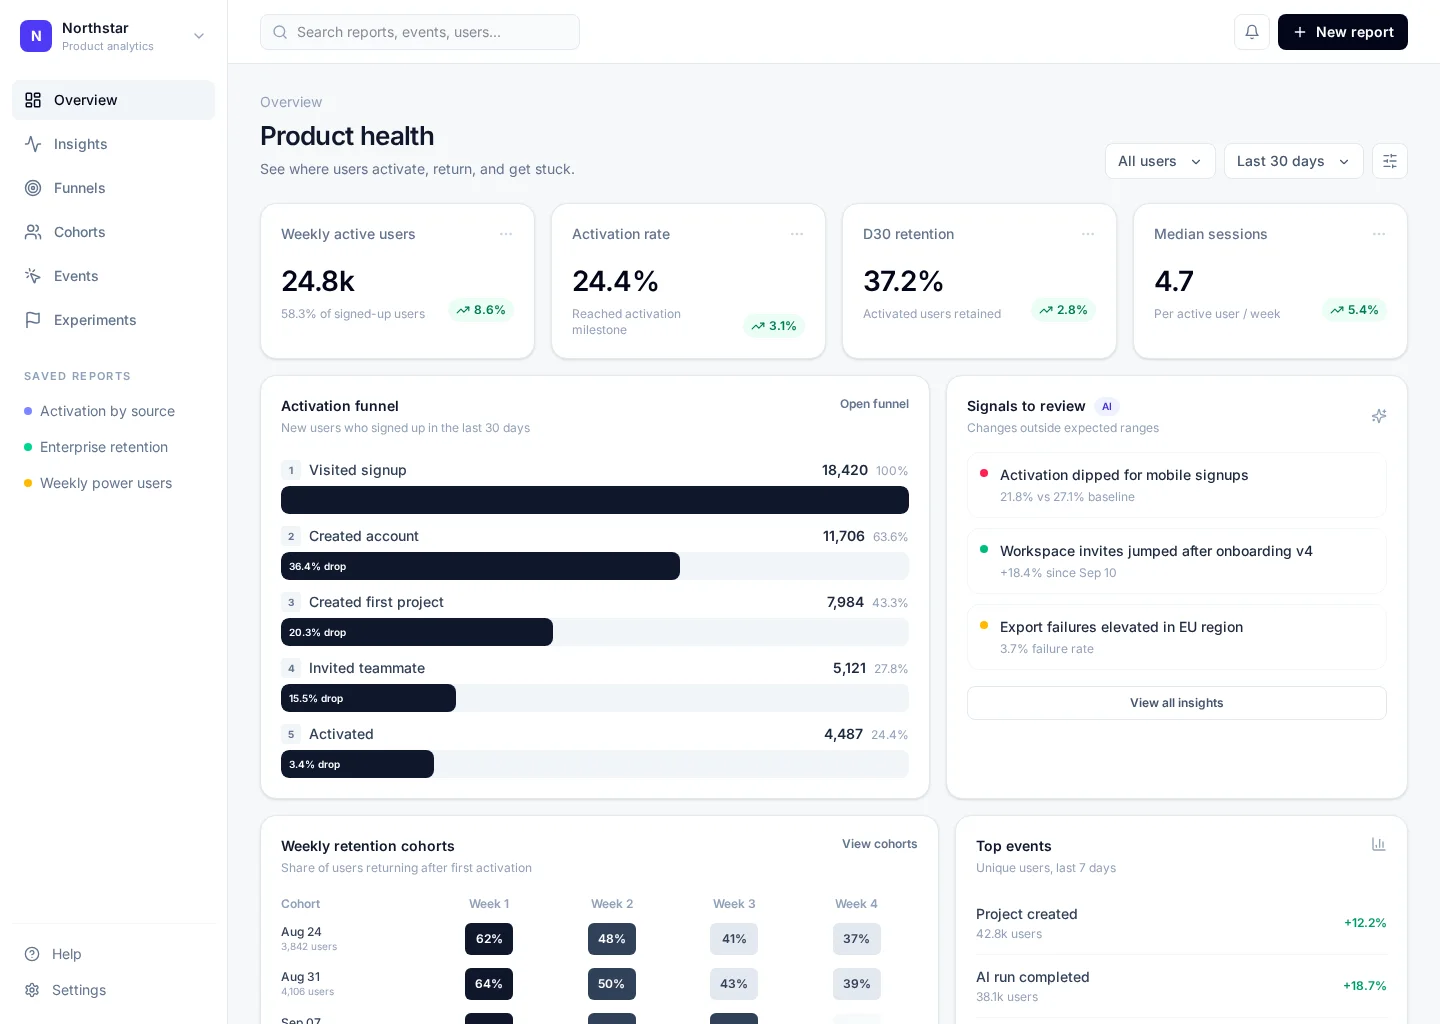
Study the dashboard layout, find the main metrics, and check how the team moves from Overview to Records. Use the actual Figr screen as the starting point for a product-aware design.
Analytics
Review analytics dashboard
Analytics
Default, loading, empty, error, permission, success
Configurable product UI theme
Teams need to read the most useful signals quickly, spot what changed and open the right records. Make the trend, owner, next action and alert state clear, without turning the screen into a wall of cards.
Overview → Records → Review analytics dashboard → Review outcome
Analytics, Overview, Records, contextual actions, error recovery
Keep the time range and metric definition visible. Let people see which segment or filter produced the result, then explain missing or delayed data.
Pay attention to overview and records. People need to distinguish Analytics Dashboard overview from Recent activity. Keep open items visible, especially when a record changes owner or status.
Before this screen reaches handoff, verify keyboard focus, empty and permission states, and what happens after someone chooses “Review analytics dashboard”. Make error recovery as clear as the happy path.
Related screen examples to explore next: .
Design a analytics dashboard screen inside our existing product. Use our current components, tokens and content language. Include Overview and Records views, credible records like Analytics Dashboard overview, and a clear “Review analytics dashboard” action. Use our product permissions and show loading, empty, error and success states. Keep the output editable in Figma.