
Most teams treat decisions like a conveyor belt, a linear path from A to B. But that's not how choices work. A real decision is a switchboard, where flipping one switch changes the connections for everything that follows. A decision tree is how you map that switchboard.
This isn't just about making a flowchart. It’s a tool for making your thinking visible.
A decision tree is more than a diagram, it's a map of consequences. Its structure is designed for one thing: clarity.
- Root Node: This is the core decision you're facing.
- Branches: These represent the different choices or actions you can take.
- Leaf Nodes: These are the final outcomes at the end of each path.
This structure forces you to game out every possible result of a choice. A friend at a Series C company told me they use them to get engineering and marketing aligned before committing to a six-month roadmap. Why? Because it moves them from debate to a final decision. It creates a shared language for trade-offs, making the logic behind a choice visible to everyone. It's a practical framework for getting From Tech Chaos To Clarity when planning your next move.
The Origin of Consequence Mapping
While they feel intensely modern, the core idea has been around for decades. The concept first crystalized in 1963 when James Morgan and John Sonquist developed the Automatic Interaction Detection (AID) project. Their work, considered the first decision tree algorithm, introduced a revolutionary way to recursively split data into subsets to find patterns. You can find more on their pioneering work at explorium.ai.
What began as a statistical tool for survey analysis is now essential for product teams making defensible choices. By turning a mess of variables into a simple visual story, you build conviction.
It’s how you make your thinking visible.
Framing the Core Problem You Need to Solve
Before you draw a single box, you must define the question. A decision tree is only as good as the problem it’s built to solve. Start with a fuzzy question, and you will end up with a confusing map.
I once watched a product manager at a fintech company burn weeks debating a new feature. His team built elaborate models, comparing development costs against potential revenue. After all that work? Deadlock.
Why?
They were asking, "Should we build feature X?" The real question, the one that mattered, was, "What is the fastest way to reduce churn in our highest-value user segment?" The first question invites a simple yes/no. The second sparks a genuine search for solutions. A clear question is the trunk from which all sound decisions branch.
Sharpening Your Root Question
A poorly framed question leads to a tree that maps the wrong territory. Your goal is to move from a vague business problem to a specific, answerable decision. It’s the difference between asking, "How can we improve engagement?" and "Should we implement a loyalty program or a referral system to increase 30-day retention by 5%?"
Your decision tree shouldn't be a tool for brainstorming. It is a tool for navigating choices you've already identified. It provides structure, not ideas.
To sharpen your focus, concentrate on these areas:
- Define the Boundaries: What is explicitly in-scope? What is out-of-scope? Are you deciding on a vendor for one department or the whole company? Be specific.
- Establish Success Metrics: How will you know you made the right call in a year? Define the key metrics: conversion rate, user satisfaction, engineering cost.
- Identify Stakeholders: Whose buy-in is critical for any path to succeed?
Crafting a precise question is a foundational skill. For more on this, our guide on how to write an effective problem statement can help you start on solid ground. A well-framed problem transforms this from an academic exercise into a potent strategic tool.
Don't start drawing until you can state the central question in one, unambiguous sentence.
Mapping the Paths With Data and Criteria
A decision tree without data is a sketch of opinions. Its power comes from fueling it with the right information: the criteria that matter, the data that backs them up, and the potential paths that spring from your core question.
Think of it like building a nervous system for your decision.
Each branch is a nerve pathway, but it needs signals to fire. Those signals are your criteria. Last week, I watched a PM decide between two checkout flows. One was familiar, the other novel but faster. The debate was circular until they listed their criteria: conversion rate, average time to complete, engineering cost, and brand perception. Suddenly, the debate had structure.
From Variables to a Structured Map
The basic gist is this: you must translate business goals into measurable inputs for your tree. These inputs fall into two primary camps.
- Quantitative Criteria: These are the hard numbers. Think engineering hours, subscription costs, or user conversion rates. They are objective and form the bedrock of logical analysis.
- Qualitative Criteria: These are fuzzier but no less important. Consider user delight, team morale, or brand alignment. Ignoring them leads to decisions that look good on paper but fail in practice. You can often score these on a simple 1-5 scale to make them usable.
Once you have your list, ask: are all criteria equal? Probably not. Assigning weights reflects business priorities. Is a 10% cost reduction more important than a 5% increase in user satisfaction? Weighting forces that conversation. You can find more insights on this by learning about primary customer research.
A decision tree forces you to externalize the hidden logic of a choice. It makes you write down the variables you're juggling in your head, creating a shared artifact for the entire team to inspect.
This process is crucial for complex systems. A great example of this thinking in action is a Figr project that mapped every possible state for Zoom during network issues. For inspiration, see the full network degradation scenario for Zoom, creating a complete map of user flows and edge cases. This kind of exhaustive mapping is exactly what you’re aiming for when brainstorming choices.
The goal isn't just to list paths, but to understand the terrain they cross. Each branch should be a distinct choice. Your data is the compass that guides you through that terrain.
Building and Pruning Your Decision Model
You’ve framed your question and mapped the criteria. Now you build. This is where your tree takes shape.
The process is called recursive splitting. You start with your main question, the root node, and draw a branch for each possible answer. At the end of that branch, you add a new node: either the next decision or the final outcome. You repeat this until every path has an end. This branching isn't random. To be useful, it must lean on clear splitting criteria like Gini Impurity or Information Gain. These are just fancy ways of asking, "Which question does the best job of sorting my data into clean piles?"
This diagram shows the basic idea: you start with criteria, which guide your choices, and use data to ensure you're on the right track.
It’s a simple visual, but it captures the journey from an abstract idea to a data-backed choice. If you’re working with complex datasets, understanding the difference between supervised and unsupervised machine learning can sharpen how you build your model.
The Art of Pruning
Building is half the battle. If you aren’t careful, your tree will grow into a sprawling mess, a problem known as overfitting. It might perfectly explain old data, but it will be useless for predicting future outcomes because it’s tuned to irrelevant details.
This is where pruning comes in.
Pruning is strategic simplification: deliberately cutting weaker branches to simplify the model without wrecking its predictive power. You aren't mapping every possibility, you're highlighting the most probable ones. This concept was a huge leap forward when the Classification and Regression Tree (CART) algorithm was developed. CART introduced methods for snipping off unnecessary branches, which made these models dramatically more efficient.
The most useful decision tree is not the one with the most branches. It’s the one that provides the most clarity with the least complexity. Your job is to find that balance.
A well-pruned tree is easier to explain and more likely to give you real, actionable insights. This is crucial when you get to the end of a branch and need to calculate its value. For more on that, our article on creating an ROI template can help you put a number on those final outcomes.
Building a tree is an exercise in structured thinking. Pruning it is an exercise in strategic focus. You need both.
Making Your Decision Tree a Shared Artifact
A decision tree in your head is a hypothesis. One in a dense spreadsheet is an academic exercise. Its value is unlocked only when it becomes a shared artifact, a common language for your team to debate and commit.
A decision on paper is a liability. A decision understood by the team is an asset.
Your tree needs to invite discussion, not intimidation. Does it clearly articulate the logic? Does it make the recommended path obvious without hiding trade-offs? A good visual tree is a story that ends with a clear call to action, not a puzzle.
This visualization process is a clarifying agent. It forces you to simplify language and ensure every node and branch has a distinct purpose. This is where many teams fall short: they see the diagram as the goal, not the vehicle. The real goal is alignment.
From Logic to Legibility
The goal is to move from a complex model to an intuitive diagram. It’s about translating statistical logic into a compelling visual narrative. What makes a diagram effective?
- Clean Layout: Stick to a consistent flow, usually left-to-right or top-to-bottom. Avoid crossing lines, they create visual chaos.
- Clear Labels: Every node and branch must have a concise, unambiguous label. Instead of "Variable X > 0.7," use something human-readable like "User is a Power User."
- Visual Hierarchy: Use size, color, or bolding to emphasize the final recommended path. Guide the viewer’s eye to the conclusion.
A well-visualized tree becomes a social object. It gives people something to point at, question, and rally around.
Your decision tree diagram is not the final output. The alignment it creates is the final output. The diagram is just the tool you use to get there.
The economic incentive here is speed. As a 2022 study in the Journal of Building Engineering on Massachusetts energy codes showed, decision trees helped teams navigate incredibly complex regulations, letting them spend less time interpreting and more time acting. A polished diagram also serves as crucial documentation. It explains why a decision was made, long after the context has faded. It's a core component of strong product requirements, which you can learn more about in our guide on frameworks for Product Requirements Documents.
Before you share, ask: could a new team member understand the core logic in under two minutes? If not, it's not done.
Putting Your Decision Tree Into Practice
A finished decision tree is not a trophy. It is a tool for getting things built. Its purpose is to drag your team out of the endless cycle of debate and into development. So how do you translate this clean visual map into real-world action?
First, the tree becomes your mandate. It’s the artifact you bring to the table for stakeholder buy-in because it shows not just the path you chose, but the paths you deliberately decided against. This visible logic builds trust and aligns your entire team around a single picture of what happens next.
It becomes the team's single source of truth.
When a question pops up mid-sprint about a weird user action, the tree has the answer. It’s your best defense against scope creep.
From Model to Test Cases
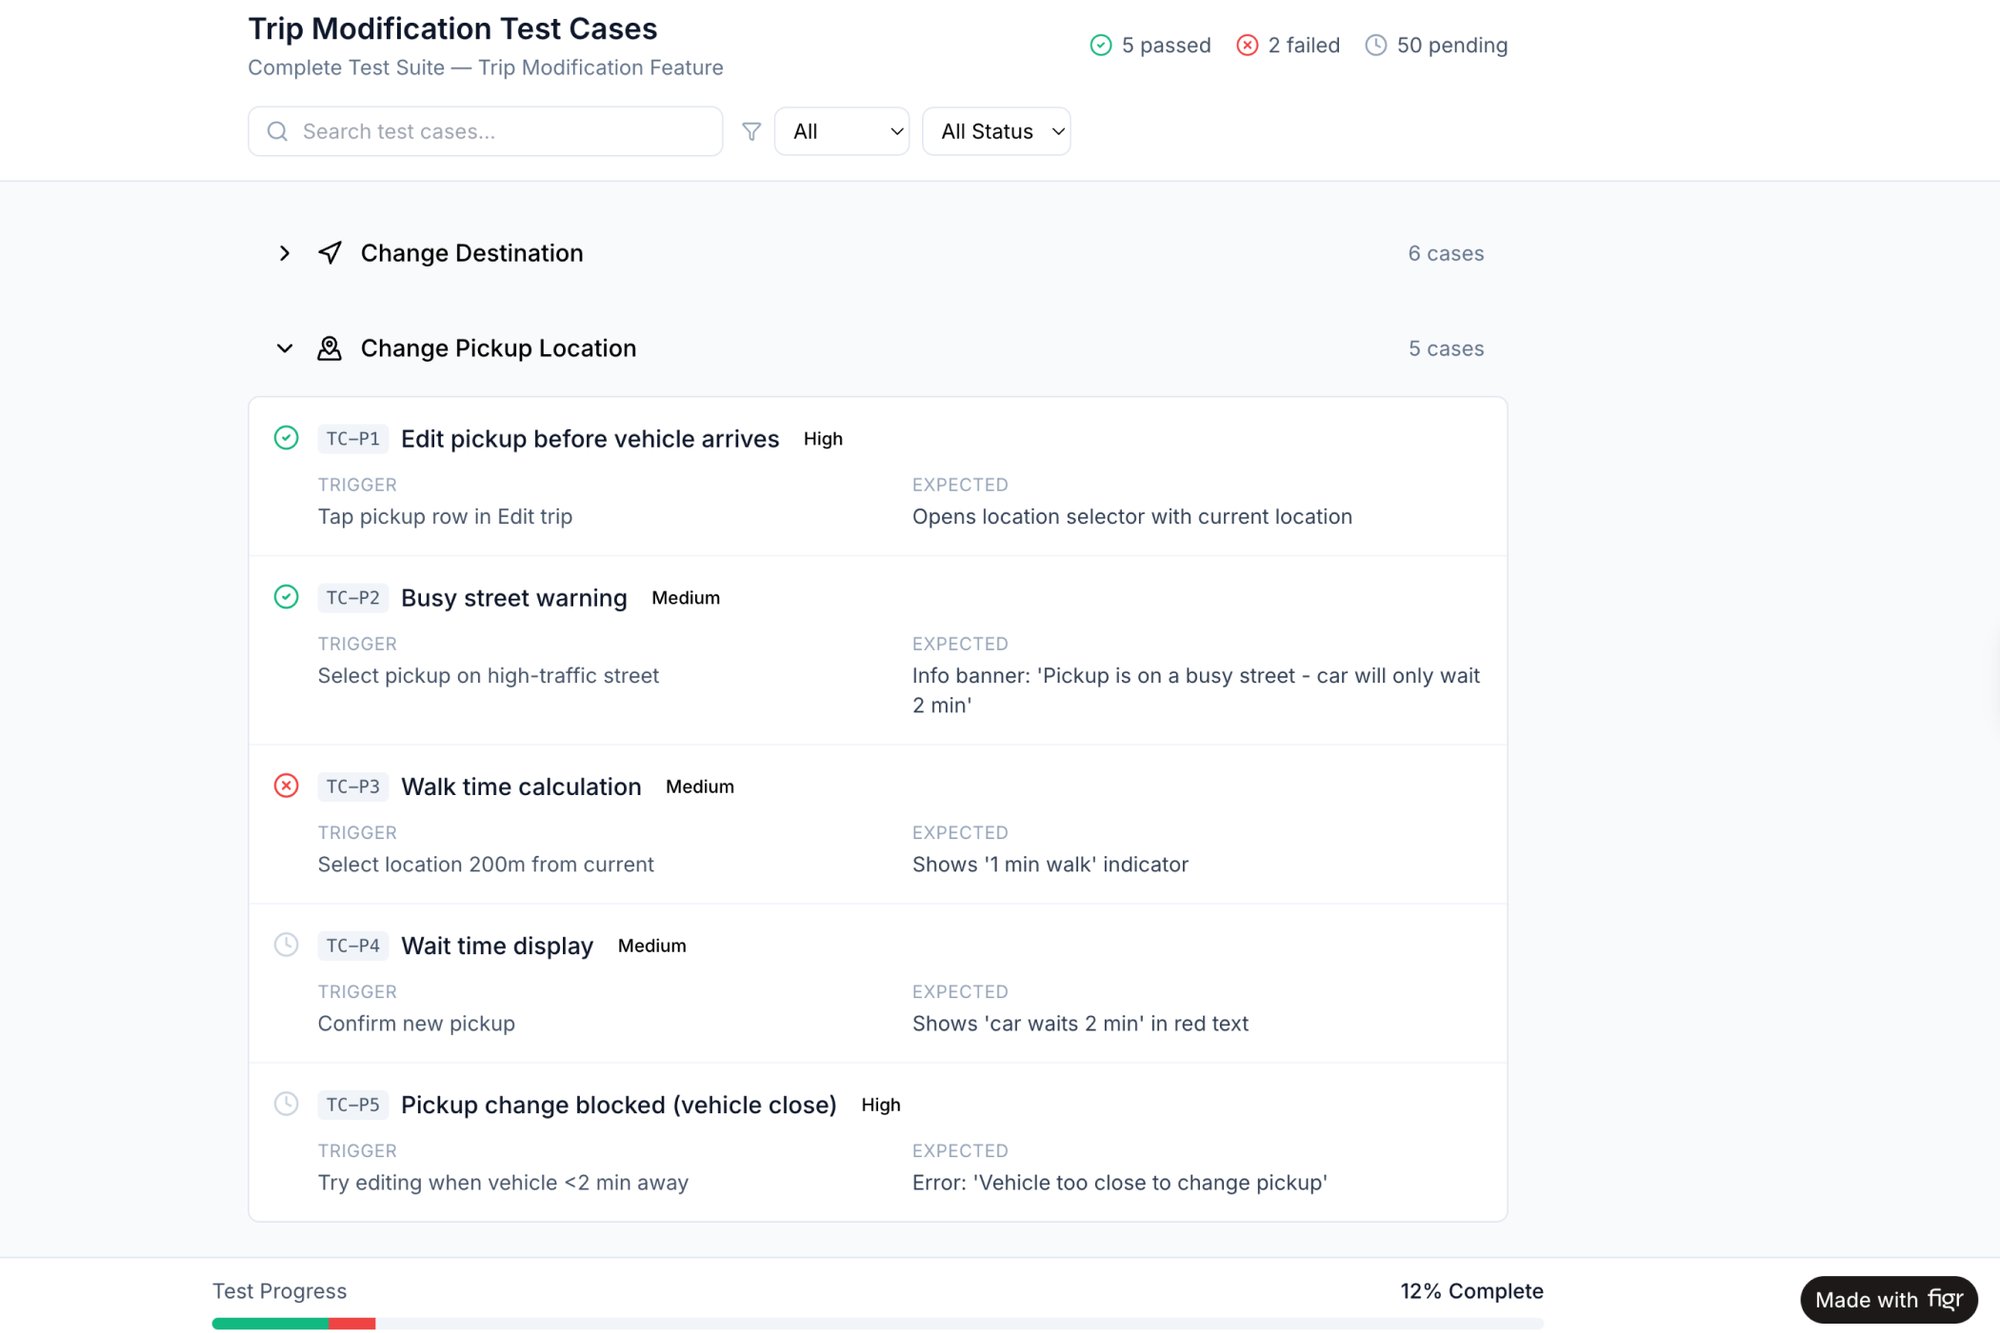
One of the most powerful uses of a decision tree is as a blueprint for quality assurance. Each path, from root to leaf, represents a distinct user journey. These journeys are the raw material for a rock-solid test suite.
Your tree doesn't just show you the right answer. It systematically reveals all the ways your product could fail, letting you build resilience before you write a line of code.
Here's what I mean: every branch is a condition, and every leaf is an expected outcome. By tracing these paths, you can generate comprehensive test scenarios covering not just the "happy path" but every critical edge case. A great example of this is the dizzying number of states possible when a user adds a stop mid-ride in an autonomous vehicle. To see this kind of logic broken down, check out the test cases generated in this Figr project for Waymo.
In short, your next step is clear. Use your decision tree to write your test plan. This ensures the logic you so carefully mapped is the exact logic that ultimately ships. No surprises.
Lingering Questions
Even with the clearest roadmap, you're going to hit forks in the road. That's a good thing. The best leaders are the ones who stop and ask for directions. Here are a few questions I get all the time from teams building their first decision tree.
How Do I Handle Uncertainty in a Decision Tree?
This is a great question. No real-world decision ever comes with a 100% guarantee, and your tree shouldn't pretend it does.
The best way to deal with uncertainty is to quantify it with probabilities. For any part of your tree that represents a future you can't control, like a competitor's reaction, you introduce a chance node. From there, you branch out into all possible outcomes, assigning a probability to each. The one firm rule is that all probabilities from a single chance node must add up to 100%.
Once you have those, you can calculate the "Expected Value" for each major path. Just multiply an outcome's financial value by its probability. This lets you compare options based on their risk-adjusted return, not just their best-case-scenario hype.
What’s the Biggest Mistake People Make?
The most expensive mistake is failing to frame the problem correctly from the start. Teams get excited, rush to the whiteboard, and start drawing branches without a crystal-clear root question. This almost always ends one of two ways: a tree so convoluted it’s useless, or a beautiful tree that solves the wrong problem.
A decision tree built on a shaky foundation will always lead you to the wrong destination, no matter how elegant its branches are.
Another pitfall is confirmation bias. This is when the person building the tree, often without realizing it, structures the logic to favor the answer they already want. To fight this, make it a team sport. Get a diverse group in the room and make it everyone's job to challenge the assumptions at every single node.
When Should I Use a Decision Tree Versus a RICE Score?
They're built for different jobs. A decision tree is your go-to when you face a sequence of choices, where one decision opens up or closes off future options. Think about mapping a complex user flow with multiple branches or figuring out a multi-stage launch strategy. It excels at visualizing "if this, then that" logic.
A framework like RICE (Reach, Impact, Confidence, Effort) is for prioritization, not navigation. You use RICE when you have a flat list of independent projects and need to stack-rank them. RICE helps you compare one initiative against another in a portfolio, a decision tree helps you navigate the winding path from a single choice to its final outcome.
A decision tree is a powerful tool, but it's just one tool. The real magic happens when you pair structured thinking with an AI partner that understands your product's unique context. Figr learns your live app, design system, and product data, then helps you generate user flows, edge cases, and test cases that are grounded in your actual UX—not generic templates. Stop starting from scratch and start shipping faster. See how at https://figr.design.