
It’s 10:13 AM on a Tuesday. The roadmap meeting is tomorrow. Your team is deadlocked, debating two major features, and the data is pointing in both directions. Opinions are loud. You need a tiebreaker, something grounded in what people actually need, not just internal conviction.
This is the moment primary customer research becomes your most valuable asset.
It isn't about commissioning a massive, dusty report. It's the focused act of gathering new, firsthand information directly from your users to answer specific, pressing questions. Think of it as the difference between reading a weather report and stepping outside to feel the rain yourself.
The Architect and the Archeologist
Product development requires two mindsets: the archeologist and the architect.
Secondary research is the work of an archeologist. You dig through existing data like industry reports, competitor analyses, and old user feedback. This work is essential for context; it gives you a map of what's already known. It cannot, however, tell you what your specific users need right now.
Primary customer research is the work of the architect. You talk directly to the future inhabitants of your building. You ask them where they need a window, how they’ll use the kitchen, and what frustrates them about their current home. This research is a switchboard, connecting a user's present-tense problem to your future-tense solution. You gather fresh blueprints, specific to your project, straight from the source.
This is how you avoid building a beautiful feature that nobody uses.
Why Direct Insight is Gaining Ground
The industry is leaning hard into this architectural approach. There's a clear surge in demand for qualitative primary research. As noted in a report by User Interviews, a majority of researchers, 57%, have seen a significant uptick. This is fueled by growing budgets for UX research and qualitative methods. This shift isn't just about feeling closer to users, it’s about aggressively reducing risk. Every engineering hour spent building the wrong thing is a cost a simple conversation could have prevented.
And with new tools, teams can gather this feedback faster. We've written before about AI tools that automate product feedback analysis.
In short, primary research is not a detour, it is a shortcut. It’s the most direct path from a risky assumption to a confident product decision.
Choosing the Right Tool for the Job
Primary customer research is not one thing. It's a well-stocked workshop. You wouldn't use a sledgehammer to fix a watch, would you? The same idea applies here. Picking the right research method is your most important first step, as each is designed to answer a different kind of question.
This decision tree is a simple place to start. It helps you see when you need fresh, primary insights versus when existing information will do.
The flowchart boils it down: if your team cannot make a confident decision because of a gap in user knowledge, you have to do primary research. It is that simple.
The Five Core Methods in Your Toolkit
To build something people genuinely need, you must go deeper than just asking what they want. You need to understand their world. These five methods are the essential tools for getting you there.
1. Customer Interviews: The Deep "Why"
Think of interviews as investigative journalism. Your mission is to uncover the real story behind the data points. These one-on-one chats are perfect for digging into complex problems and seeing if your big ideas have legs before you write a single line of code. They answer the question: Why do our users feel or act this way?
2. Usability Testing: The Behavioral X-Ray
Here you watch people try to use your product. It’s the difference between asking for a recipe and watching someone cook in their own kitchen. Usability testing shows you exactly where users get stuck and what confuses them. It’s the best way to answer: Can people actually use this thing? We have a guide that covers automating customer interviews with AI tools which can help you structure these sessions.
3. Surveys: The View from 10,000 Feet
Surveys give you scale. They’re the satellite image to the interview's street-level view. Use them when you need to put numbers to a known issue or confirm qualitative findings with some statistical muscle. They answer the question: How many of our users think, feel, or do this?
4. Ethnographic Studies: The Anthropological Deep Dive
This is all about observing users in their natural habitat. A friend working on a fintech app spent a week shadowing small business owners. She learned their invoicing "process" was a chaotic mess of spreadsheets, sticky notes, and random emails. No survey would have ever uncovered that reality. Ethnography answers the question: What does our user’s world actually look like?
5. Diary Studies: The Longitudinal Story
With diary studies, you ask people to log their experiences with a product over time. It’s a powerful way to understand habits, see how perceptions change, and learn how your product fits into the rhythm of someone's life. Diary studies answer the question: How does our user’s experience evolve over time?
Matching the Tool to the Task
So, how do you pick one? It comes down to where you are in your project and what you do not know.
Early-Stage Exploration: Got a big idea but few details? Start with customer interviews and ethnographic studies to understand the problem.
Design and Prototyping: As you build, lean on usability testing to find friction points in your design choices.
Pre-launch Validation: Before you ship, use surveys to get a pulse on user sentiment at scale.
Post-launch Optimization: Once you're live, combine diary studies with analytics data to understand long-term engagement.
The point isn't to master every method overnight. It’s about being intentional. Before your next project kicks off, just ask yourself: What’s our single biggest, most dangerous assumption?
Then pick the one tool that’s best suited to test it.
Translating Raw Data into Shared Understanding
You just wrapped up a dozen customer interviews. Your notebook is a glorious mess of quotes, frustrations, and half-formed ideas. On its own, this raw data is just noise.
Research that lives and dies in a spreadsheet is useless. Its value is only unlocked when you forge it into a shared understanding, something the entire team can see, feel, and act on.
Think of this process less like accounting and more like cartography. You are not just tallying what people said. You're mapping a landscape of human behavior, looking for mountains of frustration, rivers of desire, and hidden pathways to a better solution.
Synthesis is about finding the meaningful patterns that connect individual data points.
From Chaos to Clarity
The first step in making sense of qualitative data is to make it visible. Get it out of your head and onto a shared canvas. This is often done with affinity mapping, where you jot down observations on sticky notes and start grouping them by theme.
It’s a deceptively simple technique. A product manager I know recently used it after interviews about a confusing checkout flow. At first, the feedback seemed random. But once the team started clustering notes on a whiteboard, a stark pattern emerged: users arriving from a social media ad were consistently getting lost on the shipping page, while direct visitors breezed through.
That one insight was the key.
Making Sense of the Numbers
Quantitative data from surveys requires a different lens. Here, your goal is to identify statistically significant segments and trends. You’re hunting for correlations that tell a story.
Do users who rate your support highly also have a higher retention rate? Does a specific demographic abandon their cart more often? Synthesis isn't about finding the 'average' user, which is often a fictional composite. It's about identifying distinct groups who use your product differently.
This is where your research can supercharge marketing. Understanding these groups is key for effective demographic segmentation in marketing. You move from broad generalizations to sharp insights about who your power users are, who is at risk of churning, and where the biggest growth opportunities are hiding.
Forging Insights into Actionable Artifacts
Now for the crucial step: translating insights into artifacts that guide development. Raw patterns are interesting, but they do not tell an engineer what to build. For that, you need structure.
This is what I mean.
User Personas: These are not fluffy marketing profiles. They are evidence-backed representations of your key user segments, born from real interview quotes and survey data.
Jobs-to-be-Done (JTBD) Frameworks: This artifact shifts the focus from product features to the "job" a user is trying to accomplish. It reframes the problem from "What should we build?" to "What outcome is the user trying to achieve?"
Product Requirements Documents (PRDs): A great PRD tells a story grounded in evidence. Every requirement should be traceable back to a specific user insight. For a deeper dive, check our guide on templates and frameworks for Product Requirement Documents.
This translation from raw data to guiding artifact is what separates research that gets admired from research that gets implemented.
Making Research Visible with Actionable Artifacts
An insight that lives only in a presentation deck is an insight that will die there. Raw data from your primary customer research, no matter how profound, is just potential energy. It's useless until you plug it into something that does real work.
The whole point is to convert that potential into kinetic energy. To turn abstract findings into concrete, visible tools your team can touch, debate, and build from every single day.
Last week I watched a PM use interview notes to build a detailed user flow map for a new onboarding sequence. Suddenly, three friction points nobody had noticed on paper became glaringly obvious. The artifact didn't just report a problem, it showed the team exactly where the problem lived.
That is the power of a visible artifact.
From Report to Roadmap
The basic gist is this: your primary customer research should directly generate the documents that engineering and design use to build. When this connection is clear, you eliminate entire cycles of debate.
Here are the key artifacts that make your research real:
User Flow Diagrams: These are visual maps of every step a user takes. Built from usability testing, they make the customer's actual path visible. Learn more about creating a powerful user journey map in our detailed guide.
Product Requirements Documents (PRDs): A research-backed PRD is a weapon. Instead of listing features based on opinion, each requirement is tied directly to evidence. It answers why it's being built, with proof.
Edge Case and Test Case Documents: Some of the most valuable insights come from exploring what could go wrong. Primary research is your best tool for anticipating errors and failures before they happen.
Real-World Examples of Research in Action
Thinking in artifacts makes research concrete. It shifts the conversation from "what did we learn?" to "what will we do with what we learned?".
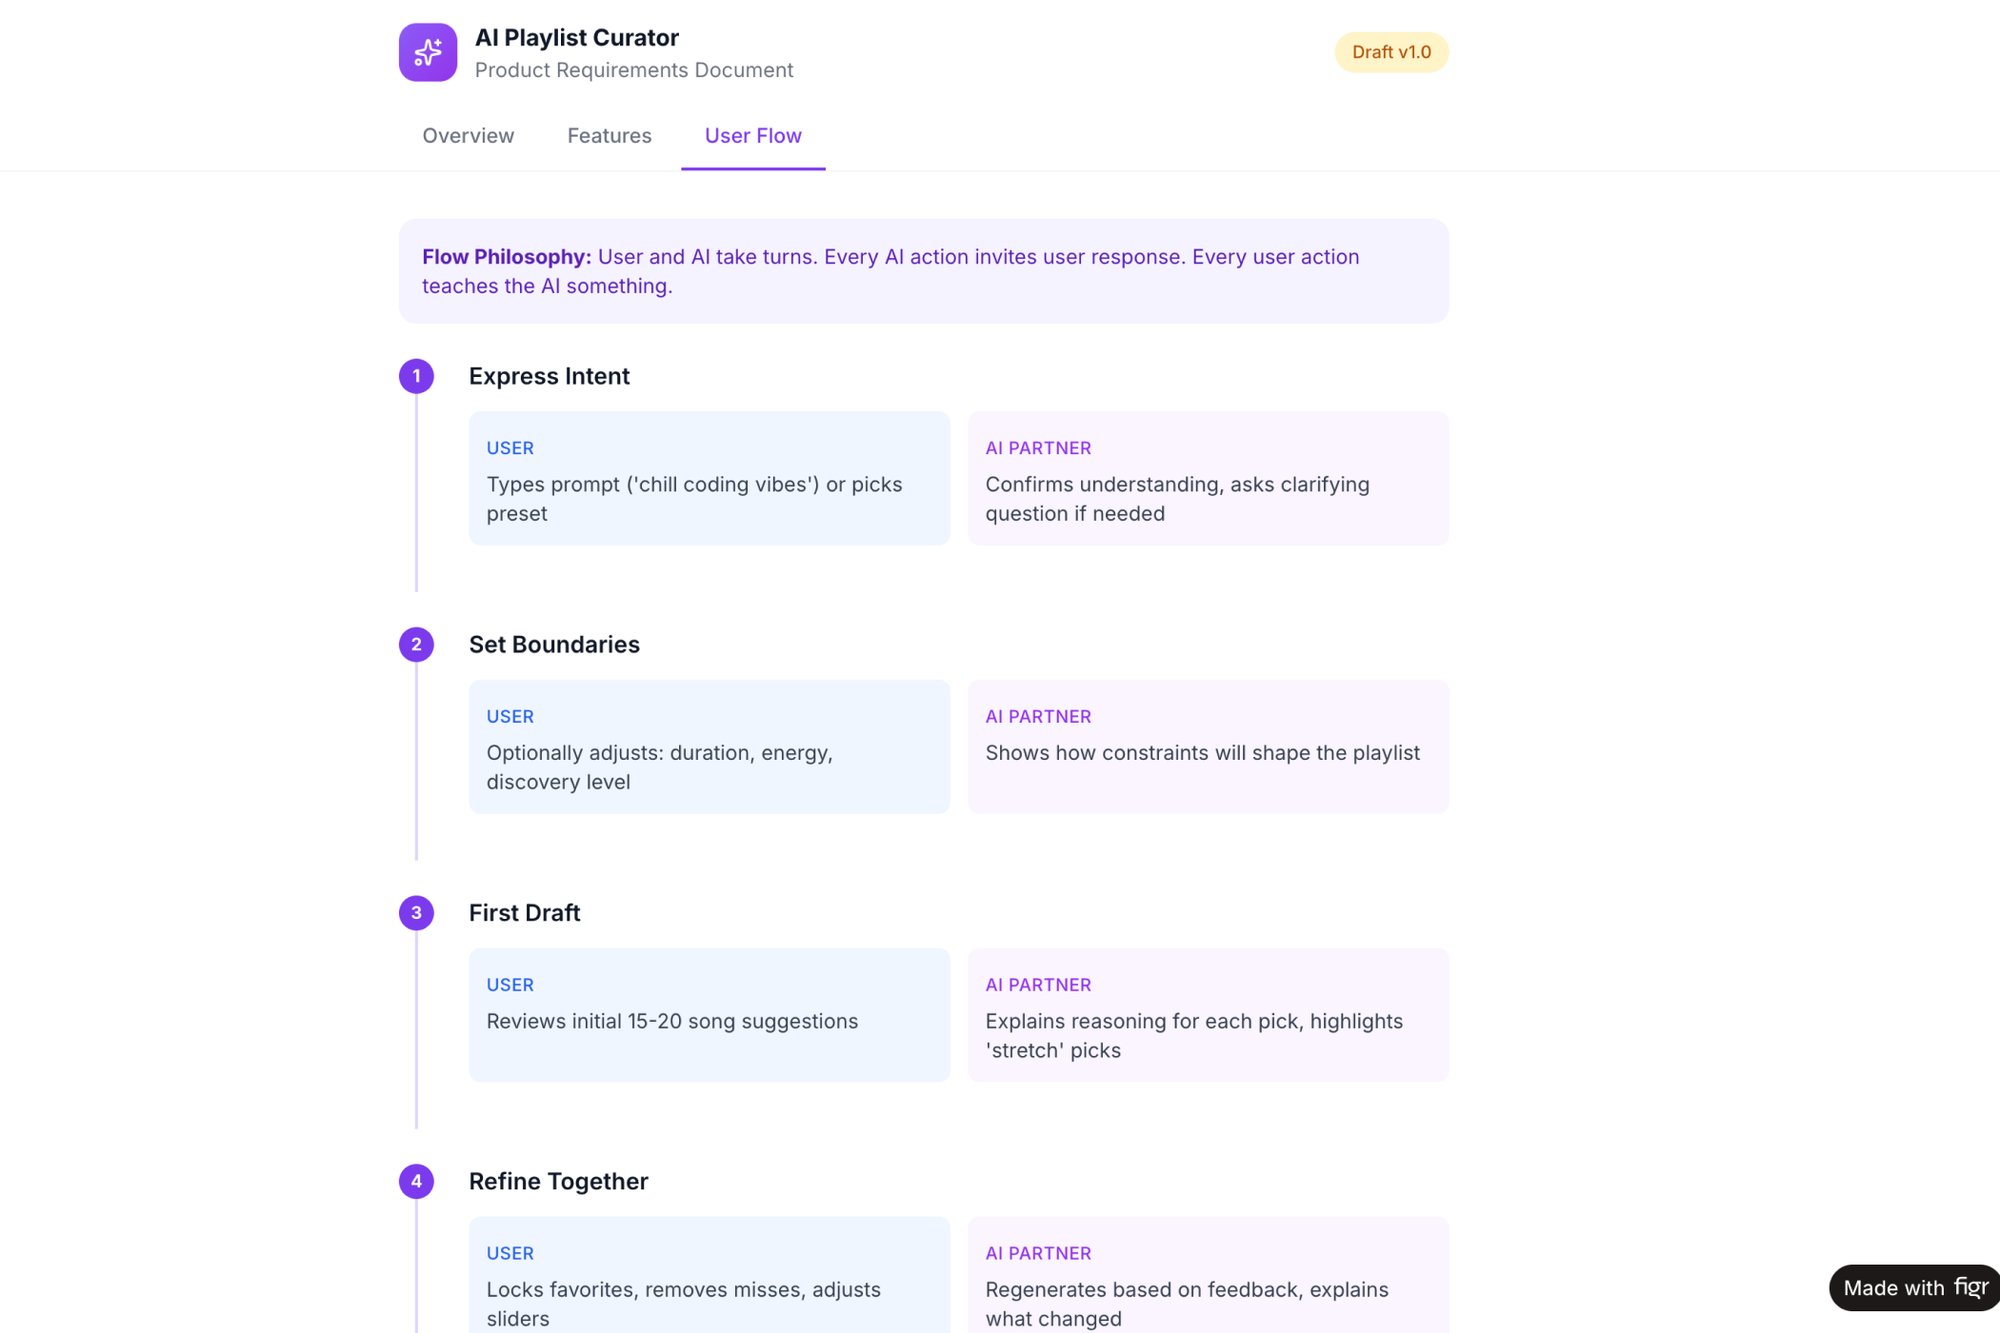
Last quarter, a team exploring music discovery turned their user interviews into a comprehensive PRD for an AI-powered Spotify playlist feature. Every feature in that document was justified with a direct quote. No arguments.
Another team working on an autonomous vehicle app simulated scenarios where plans change mid-ride. This research generated a set of critical test cases for a Waymo trip modification feature. The research became the QA plan.
This approach is especially critical for complex technical challenges. For instance, understanding a video call on a bad connection requires mapping all scenarios. You can see this in a map of network degradation edge cases for Zoom, which turns abstract technical problems into solvable user experience challenges.
These artifacts are not just documentation. They are the scaffolding upon which a great product is built.
So look at your current research findings and ask a simple question.
What artifact can we build from this?
The Economic Case for Empathy
Why does all this matter? What’s the hard business impact of spending hours talking to customers?
Because empathy is not a soft skill. It is an economic lever.
This is the moment we zoom out. Every hour a product manager spends in a customer interview can save ten, twenty, or even fifty hours of engineering rework. It’s the single highest-leverage activity a product team can do. Shipping the wrong feature isn't just a minor mistake, it's a catastrophic waste of time, money, and momentum.
Connecting Insight to Income
Deep customer understanding drives hard business outcomes. The line between a subtle insight and a healthy balance sheet is shorter than most people realize.
Higher Retention: You stop building features people tolerate and start building the ones they cannot live without.
Increased Conversion: You find and remove the invisible friction that causes users to abandon carts and sign-up flows.
Stronger Market Fit: You build what the market actually needs, not what your competitors are doing.
Ignoring this direct feedback loop is, quite simply, leaving money on the table. This trend is accelerating. This chart from PwC's Consumer Insights Survey shows a massive shift in how people buy.
The key takeaway here is that customers are actively seeking more direct relationships with companies. That 63% of consumers buying directly from manufacturers isn't just a number, it's a signal. They are voting with their wallets for experiences built on genuine understanding.
The High Cost of Guessing
Companies that get personalization right, an outcome impossible without deep primary research, drive more revenue. They are not just guessing what users want. They are essentially co-creating the product with them through a continuous cycle of research, feedback, and iteration.
This turns product development from a high-stakes gamble into a calculated investment.
The cost of not doing this research is hidden, but it's immense. It is in the months spent building a feature that gets sunsetted a year later. It is in the marketing budget wasted selling a solution to a problem nobody has. It is in the talented engineers who leave because they are tired of shipping code that doesn't make an impact.
Think of primary customer research not as a cost center, but as your best insurance policy against irrelevance.
Moving from Theory to Practice
You’ve seen the why and the how. Now comes the hard part: the what. The biggest barrier to starting customer research is not a lack of knowledge or tools.
It's inertia.
The goal is not to launch a massive, multi-month study tomorrow. The goal is to ask one good question today. Think of it like a flywheel, a heavy disc that’s tough to get moving. That first push is the hardest, but it stores momentum, making every next push easier.
That first small action is everything.
Turning Inertia Into Momentum
A product manager I know got completely stuck. His team spent two weeks debating a new feature design, with strong opinions pulling them in every direction. The real problem? Their entire plan was built on a single, unverified assumption about how users would react to a new workflow.
They were arguing about the color of the bikeshed while the foundation was still sand.
To get going, it helps to see the bigger picture. Understanding the basic marketing research stages can give you a roadmap, turning a vague idea into a structured effort.
You do not need a perfect plan to start. You just need a focused question. That's your first push on the flywheel.
Your First Question, Your Next Five Conversations
Here is your takeaway. Something you can do this week.
Identify the single biggest assumption in your upcoming feature. Is it that users will instantly get the new navigation? That they’ll find value in that new dashboard widget?
Your riskiest assumption isn't a technical one. It is the human one, the belief you hold about what someone else will think, feel, or do when they encounter your work.
Once you have it, turn that assumption into a simple, open-ended question. Not a leading one like, “Don’t you think this dashboard is useful?” Instead, try, “Walk me through how you’d use this dashboard to prepare for your weekly meeting.”
Next, find five users.
Just five. Recruit them from a customer list, a friendly Slack community, or a targeted post. Schedule 30-minute conversations using a tool like Calendly. Your only job is to listen.
This small, focused action is the first turn of the flywheel. It might feel tiny, but it’s the most important one you’ll make. It’s how you start replacing assumptions with evidence, one conversation at a time.
Still Have Questions About Customer Research?
The idea of conducting primary customer research can feel intimidating. Where do you even begin? Below are answers to some of the most common questions that hold product teams back.
How Can We Start with a Small Budget?
You don't need a massive budget to get started. Begin by "recruiting" users you already have access to: people who recently filed support tickets or active members of your community forum. These are people who want to talk to you. A simple video call is all the tech you need. The goal is not a perfect, statistically significant study, it is five conversations.
How Do I Convince Stakeholders of Its Value?
Speak the language of risk. Specifically, risk reduction.
Frame your first research project as a small experiment to de-risk a major assumption. Don't ask for a "research budget." Instead, say something like this:
"Let me spend three days talking to five customers to make sure we're not about to waste two months of engineering time building this feature the wrong way."
When you connect research directly to saving time and money, the conversation changes. It is no longer a "nice-to-have", it is insurance against building the wrong thing.
How Are AI Tools Changing the Research Game?
AI isn't replacing researchers, it's giving them superpowers. New tools are collapsing the most tedious parts of the research cycle. An AI can transcribe interviews in minutes, pull out key themes, and even help generate first drafts of reports and personas.
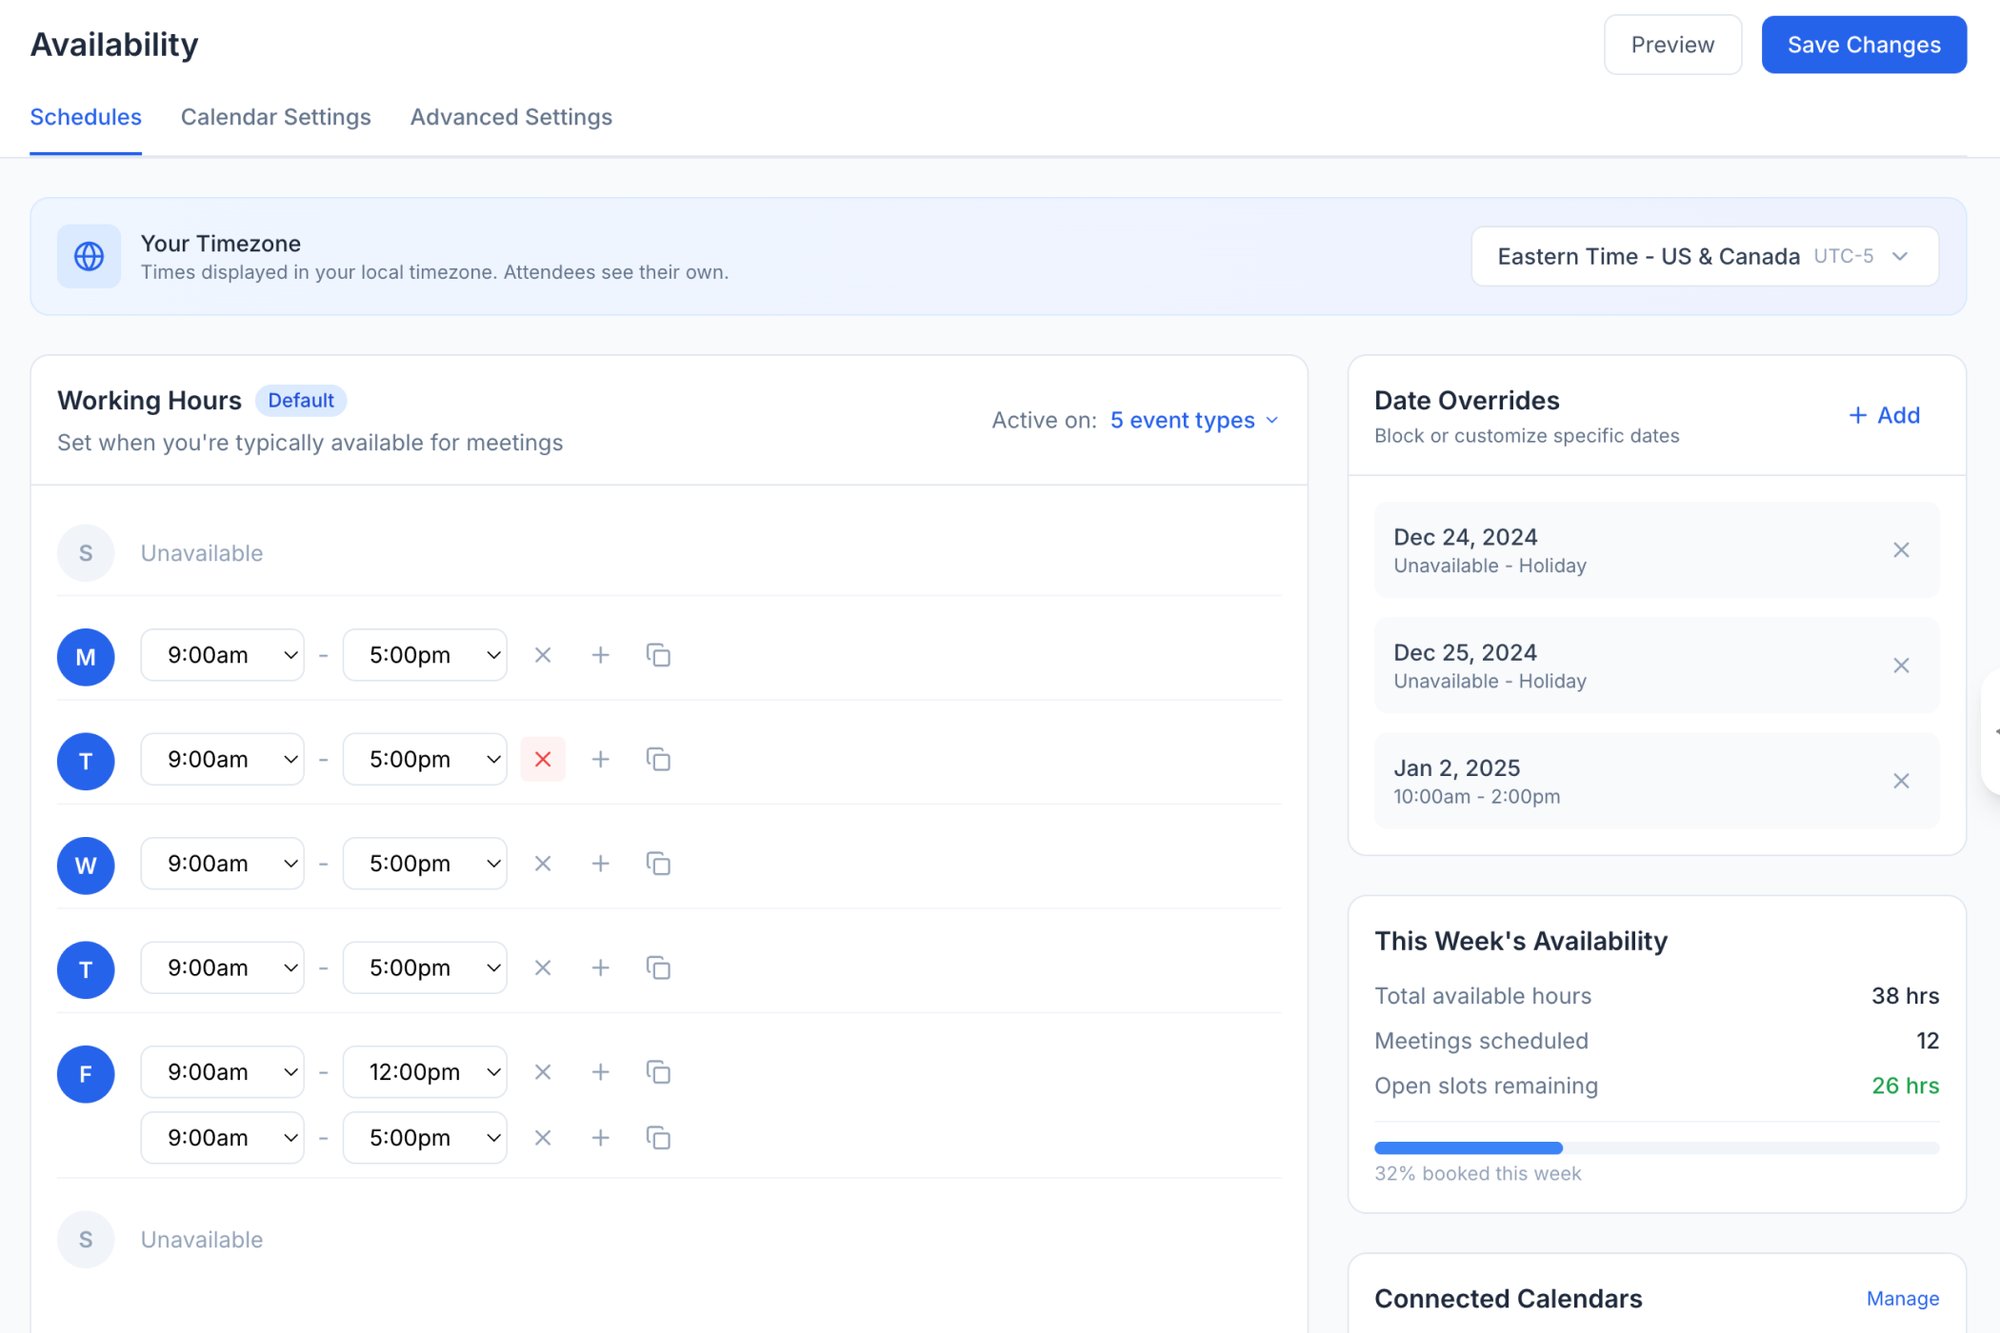
This frees you up for what actually matters: talking to users and thinking strategically. For instance, you could use an AI assistant to analyze screenshots of a competitor's confusing flow, generate a list of potential usability test cases, and even propose a cleaner prototype to test with users, like this redesigned scheduling page.
Primary customer research turns uncertainty into action. Figr is the AI design partner that helps you embed that action directly into your workflow, generating user flows, prototypes, and test cases grounded in your real product context. Stop guessing and start designing with confidence.