
A feature you scoped for five days is now crawling into its third week. The ticket is a ghost in the machine, stuck in 'Code Review'. You feel the project timeline stretching, becoming thin and transparent like pulled candy, but you can't point to the exact moment it all went sideways.
Where did all that time actually go?
This isn’t a failure of effort; it's a failure of measurement. We often treat development like a linear race, but it’s really more like a series of gates, each with its own hidden timer. The cycle time calculation formula isn't just an abstract metric.
It's the stopwatch for each one of those gates.
Pinpointing Active Work
Unlike broader metrics, cycle time zooms in exclusively on the active work phase. The clock starts the second a developer pulls a ticket into an "In Progress" column and stops the moment it’s shipped or moved to "Done."
It answers one critical question: how long does it take for an idea to move through our hands-on delivery system?
The basic gist is this: it filters out all the noise from backlog grooming and prioritization meetings, focusing only on the value-creation window. For product teams, this is the most controllable part of the entire delivery process. A friend at a SaaS company recently did this analysis and discovered their user stories, once started, took an average of eight days to complete. The shocker? Nearly five of those days were spent just waiting, for code reviews or QA feedback.
The problem wasn't their coding speed. It was their handoffs.
Why This Metric Changes Everything
Understanding cycle time is the first step to finally seeing the invisible currents of delay that pull your projects off course. It exposes the friction in your system, not in your people. The goal isn't to make individuals work faster; it's to make the system flow smoother. Does a long cycle time point to lazy engineers? Almost never. It almost always signals a bottleneck, a dependency, or one of the common signs that your product development cycle is broken and how to fix them.
According to The Principles of Product Development Flow, managing queues (the time spent waiting) is the single most effective lever for improving product development performance. Cycle time makes those queues visible.
This shift in perspective is profound. It moves the conversation from, "Why is this taking so long?" to a much more productive, "Where is this task getting stuck?" The basic formula is your entry point: a simple tool to start asking much better questions.
The Core Formula and Why Averages Lie
At its heart, cycle time is simple. It's the clock that starts ticking the moment someone actually begins working on a task and stops the second that work is finished. It’s your process’s most honest stopwatch.
The standard cycle time calculation formula is exactly what you'd expect:
Cycle Time = End Date – Start Date
But here's the crucial detail: the "Start Date" isn't when a task was created or tossed into the backlog. It’s the moment a developer pulls it into an active column, like 'In Progress' on a Jira board. The "End Date" is when that work is truly done and delivered.
The real danger, though, is stopping there. Calculating the average cycle time for your team is like describing a forest by the average height of its trees. You get a general idea, but you completely miss the towering redwoods and the struggling saplings.
That’s where the real story is.
The Coffee Shop Analogy
Imagine you run a busy coffee shop. Time isn't a conveyor belt; it's a switchboard connecting orders to outcomes. Your average time to make a latte is three minutes. Sounds pretty good, right?
But what if that average is hiding a painful reality? Some lattes are out the door in 90 seconds, while others take a full seven minutes.
Those seven-minute orders are your greatest teachers. They expose every hidden bottleneck in your system. Maybe the espresso grinder keeps jamming. Perhaps a new barista is struggling with the milk steamer. Or maybe one complicated, six-modifier order threw the entire workflow into chaos.
You don’t fix problems by celebrating the average. You fix them by digging into the painful outliers. It’s the exact same story in software development.
From Manufacturing to Product Teams
This focus on the small details has deep roots. The cycle time formula, often expressed as Net Production Time divided by the Number of Units Produced, is a classic manufacturing metric. When one manufacturer applied this, they found they produced a single unit every 1.5 minutes, a precise number that allowed for incredibly targeted improvements.
For modern product teams, this means looking beyond that single, seductive average. Your goal isn't just to find a number; it's to understand the distribution. A five-day average cycle time might feel acceptable, but what if 10% of your tasks take over 20 days?
Those are the tickets that derail sprints, frustrate stakeholders, and signal deep, systemic friction. By digging into those outliers, you uncover the real opportunities to improve your process. Combining this with the right product analytics tools that integrate AI can give you an even clearer picture of where things are really getting stuck.
How to Calculate Cycle Time with Real-World Data
Theory is one thing. Actually wrestling with the messy reality of your team’s workflow is another. Data from tools like Jira isn't a clean timeline; it’s a series of stops, starts, and handoffs.
Let's make this real.
Imagine a single task for a mobile app update: "Fix Login Button Responsiveness." It moves across a typical Kanban board over a few days. The workflow isn't a straight line, it's a pinball machine of states and statuses.
- April 8, 11:00 AM: A developer pulls the ticket from 'To Do' into 'In Progress'. The stopwatch starts.
- April 10, 4:00 PM: The code is done. The ticket slides into 'In Review'. The clock is still ticking.
- April 11, 3:00 PM: After some feedback, it moves to 'Testing'.
- April 12, 1:00 PM: QA gives the green light, and the ticket lands in 'Done'. The stopwatch stops.
The calculation itself is just subtraction: End Date (April 12, 1:00 PM) - Start Date (April 8, 11:00 AM). This gives us a total cycle time of roughly 4 days and 2 hours.
The Prerequisite to Good Data
The math is easy. The process discipline is hard. I recently watched a team struggle with this exact problem. Their cycle time reports showed massive numbers, but no one believed them. Why? Because their Jira workflow was a mess. Statuses were ambiguous, and there was no shared agreement on when work truly began or ended.
This is what I mean: process discipline is a prerequisite for accurate measurement.
Before you can trust the cycle time calculation formula, your team absolutely must agree on a few key definitions:
- A clear "Definition of Start": Which column on your board marks the true beginning of active work? Is it 'In Progress' or something earlier?
- A clear "Definition of Done": What criteria must be met before a task is considered complete? Is it when code is merged, or only after it's live in production?
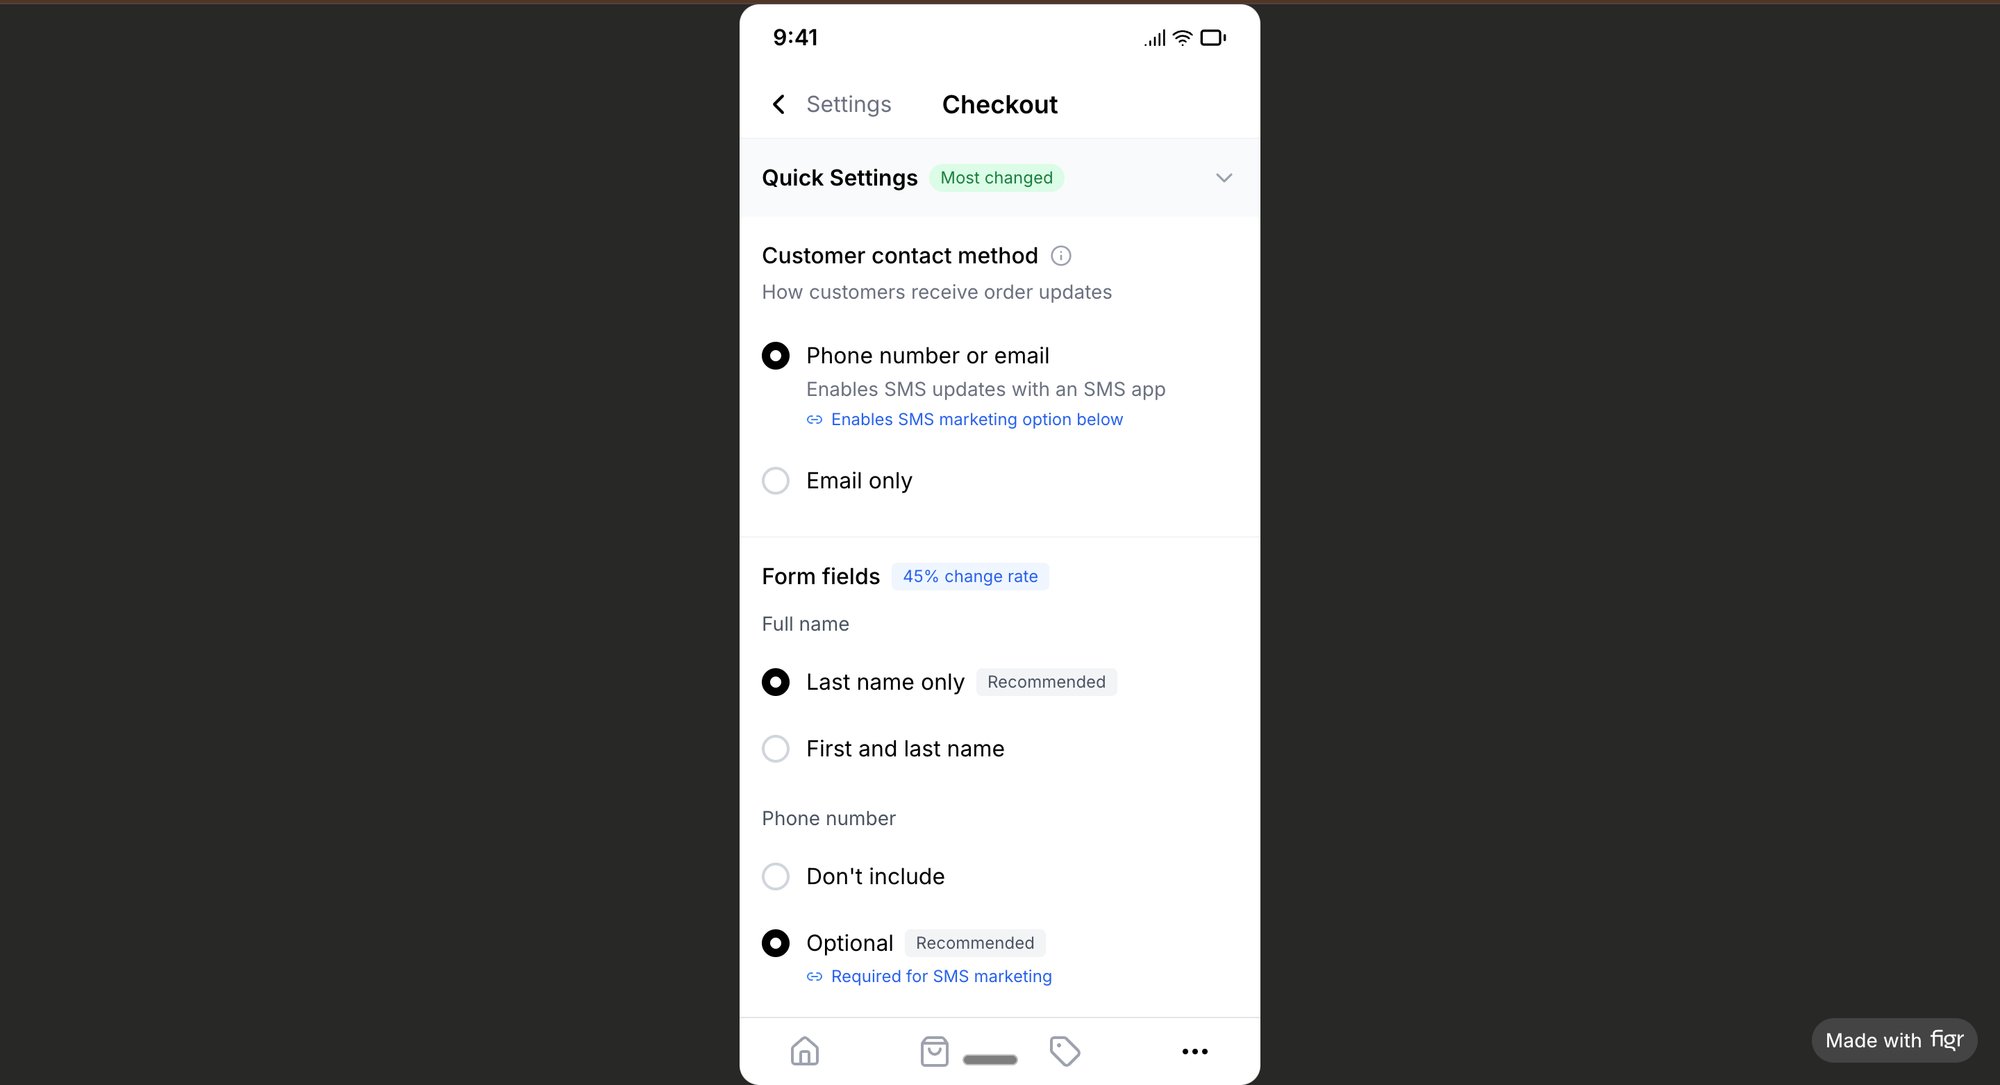
Without this shared understanding, you're just measuring noise, not actual performance. To see how these states play out in a real-world component, we’ve mapped a similar flow in Figr, showing how a task card handles actions like 'Approve', 'Reject', and 'Reassign'. You can view the component states to better visualize this journey.
From a Single Ticket to a Full Sprint
Once you can calculate the cycle time for individual tickets, you can start to zoom out. By tracking the cycle time for every task completed in a two-week sprint, you begin to see patterns, not just isolated numbers.
This is the first step toward moving from measuring a single task to truly understanding your system's capability. Using a freeware process mapping software can help visualize these flows and spot the bottlenecks you couldn't see before.
Beyond The Formula: The Power of Distribution
A single cycle time number is a data point. A collection of them is a diagnosis. Learning to read that diagnosis is where the real insights are hiding.
This is the zoom-out moment. The way your cycle times spread out across a chart doesn't just reflect your process; it reflects the economic incentives and behavioral patterns of your entire system. A process plagued by constant interruptions and shifting priorities will produce a chaotic, unpredictable distribution of cycle times.
Why? Because the system implicitly rewards starting new things over finishing existing ones.
This visual highlights how cycle time represents the active, hands-on work phase within the total project duration.
Reading the Scatterplot
The most powerful tool for this is a Cycle Time Scatterplot. This simple chart plots every completed task as a dot, showing its cycle time against its completion date. It reveals far more than an average ever could.
What does a tight, low cluster of dots mean versus a wide, unpredictable spray?
- A tight cluster signals predictability. Your process is consistent, and you can forecast delivery with confidence.
- A wide spread signals chaos. Unpredictable cycle times are a symptom of deeper issues like constant context switching, vague requirements, or external dependencies.
A friend at a Series C company recently showed me their scatterplot. Their average cycle time looked fine, but their 95th percentile was four times higher. The chart made the problem painfully obvious. The issue wasn't slow developers; it was the approval process for new API keys, which involved three different departments and took days. The scatterplot made this systemic friction impossible to ignore. A process map of this flow would have shown a glaring red box labeled "WAITING," a classic example of how scope creep can manifest in process.
In short, your data, when viewed as a distribution, tells a similar story. You just have to learn how to read it.
Three Actionable Steps To Reduce Your Cycle Time
Measurement without action is just trivia. You now have the tools to apply the cycle time calculation formula and see where your time goes.
So what comes next?
The answer isn't about working harder. It’s about creating a smoother, more predictable flow. Think of your workflow not as an assembly line, but as a river. The goal is to remove the dams and fallen logs that slow the current, not to somehow make the water itself move faster.
We'll focus on three high-leverage ways to do just that.
1. Limit Your Work in Progress (WIP)
The most counterintuitive truth in knowledge work is this: starting less work gets more work done. When a team is juggling ten "in-progress" tasks, they are really making slow, fragmented progress on all ten. Each task carries a cognitive load, and every time a developer switches context, they lose momentum.
It's a killer of focus.
Limiting WIP isn't just about setting a column limit in Jira; it's about instilling the team discipline to finish existing work before starting anything new.
This simple act forces collaboration. When a developer can't just pull a new ticket, they naturally turn to help unblock their teammates. They swarm on code reviews, assist with testing, and solve problems together. This cultural shift directly attacks the waiting periods that bloat cycle times.
2. Shrink Your Batch Sizes
Large, monolithic features are the enemies of flow. A task that takes weeks to complete is a black box of risk, hiding integration problems, misunderstandings, and dependencies until the very end. Smaller batch sizes, like breaking a big feature into five smaller, independently shippable stories, have a profound effect. For instance, instead of one giant "Redesign Checkout" task, you might have separate, smaller tasks like "Add Zip Code Validation" and "Improve Card Entry UI".
Here’s why this works:
- Faster Feedback: Each small batch gets through the entire cycle—code, review, test, deploy—quickly. This gives you rapid feedback from real users, not just internal stakeholders.
- Reduced Risk: A problem with a small batch is a small problem. A problem discovered late in a large batch is a crisis.
- Increased Morale: Shipping small wins frequently builds momentum and a sense of accomplishment. Nothing feels better than getting things done.
3. Visualize and Automate Handoffs
Every time a task moves from one person or team to another, it's a potential point of failure. The time a ticket spends waiting for a code review or a QA pass is often the single largest component of its cycle time.
It's just sitting there.
The first step is to see the friction. A great way to do this is by mapping your current process. Seeing the entire journey laid out often reveals obvious opportunities for simplification. For example, in a Linear vs. Jira task creation comparison, you can visualize every click and identify unnecessary steps that add drag. Even mapping a simple flow, like freezing a Wise card, can reveal unexpected complexities and wait states.
As you look for ways to cut down your cycle time, using modern technology is a no-brainer. Exploring various AI tools to boost productivity can significantly streamline workflows. Automating notifications for code reviews or building CI/CD pipelines to handle testing and deployment eliminates manual steps and keeps work moving.
Your Next Step: Measure One Thing
It’s easy to get buried in new metrics and processes. The point isn't to overhaul your entire workflow tomorrow.
The goal is to gain one new insight.
Here’s your grounded takeaway: pick one type of recurring task your team handles. It could be ‘bug fixes’ or maybe ‘small UI updates’. For the next two weeks, manually track the cycle time for just those tasks. Note the start date (when an engineer actually starts coding) and the end date (when it's live for customers). You don’t need fancy software yet. A simple spreadsheet is all it takes.
After two weeks, just look at the numbers.
What’s the range? Is it consistent, or all over the map? Are there obvious outliers that took way longer than the rest? This small, focused experiment will give you more clarity than a month of theoretical debates about the cycle time calculation formula.
This is how you make the abstract real. The data from your two-week experiment provides the first clue on your path to a faster, more predictable delivery process. It shifts the conversation from guessing to knowing.
This first measurement becomes your baseline. It's the first dot on a map that shows you exactly where you are and helps you decide where to go next.
Your Questions, Answered
Got a few lingering questions about calculating cycle time? You're not alone. Most teams do. Here are some straight answers to the common sticking points that pop up when you start putting this metric to work.
What's the Difference Between Cycle Time and Takt Time?
This one trips up a lot of people.
Cycle Time is the actual time it takes your team to finish one piece of work, from the moment they start until it's delivered. Think of it as a direct measurement of your process as it exists right now. It's what you are doing.
Takt Time is the rhythm you need to maintain to keep up with customer demand. It’s a target.
Here's an analogy: Cycle Time is how fast you're currently running the race. Takt Time is the pace you need to hit to cross the finish line on time.
How Do I Start Tracking Cycle Time if My Process Is a Mess?
Don't boil the ocean. If your process feels chaotic, trying to measure everything at once will only make it worse.
Start small. Get your team to agree on a clear definition for just two points: "Start" and "End." That’s it. For instance, "Start" is when a ticket moves to 'In Progress', and "End" is when it moves to 'Done'.
Track this for a small handful of work items for a few weeks. This gives you a baseline. The initial data will probably be messy, but that's okay—it will force the right conversations about how to bring some order to your workflow.
Should We Include Blocked Time in the Cycle Time Calculation?
Yes. 100% yes.
Cycle time has to reflect the total elapsed calendar time from when work begins until it's finished. This must include any time the task is sitting idle, blocked by a dependency, or waiting for a code review.
This is non-negotiable. Why? Because those waiting periods are almost always the biggest source of delay and your single greatest opportunity for improvement. Excluding them gives you a vanity metric an artificially low cycle time that hides the very problems you need to solve.
Ready to turn these insights into action? Figr helps you see your entire workflow, pinpoint the real bottlenecks, and get the data you need to actually reduce your cycle time. Stop wrestling with messy spreadsheets and start mapping complex flows, uncovering hidden problems, and shipping with confidence. See how Figr can help you ship faster.